The North is still not feeling this recovery – and the Conservatives are likely to pay for that at the polls
There has been little pick-up recently in house price to earnings ratios


Your support helps us to tell the story
From reproductive rights to climate change to Big Tech, The Independent is on the ground when the story is developing. Whether it's investigating the financials of Elon Musk's pro-Trump PAC or producing our latest documentary, 'The A Word', which shines a light on the American women fighting for reproductive rights, we know how important it is to parse out the facts from the messaging.
At such a critical moment in US history, we need reporters on the ground. Your donation allows us to keep sending journalists to speak to both sides of the story.
The Independent is trusted by Americans across the entire political spectrum. And unlike many other quality news outlets, we choose not to lock Americans out of our reporting and analysis with paywalls. We believe quality journalism should be available to everyone, paid for by those who can afford it.
Your support makes all the difference.Last week both the inflation rate and the unemployment rate went down or up depending on your preference. Consumer Price Index inflation fell from 2 per cent to 1.9 per cent while Retail Price Index rose from 2.7 per cent to 2.8 per cent. Confusingly, the unemployment rate went down from 7.6 per cent to 7.2 per cent if you compared July to September with October to December, but it went up from 7.1 per cent to 7.2 per cent if you compared September to November with October to December. More confusingly still, the single month estimate went up from 7.0 per cent in October to 7.4 per cent in November. So now I hope that’s all clear.
Average hours of full-time workers fell, which is a worrying sign that perhaps the labour market improvement is slowing. Real wages continue to fall, by around 1 per cent if you deflate by the CPI or 2 per cent if you use the RPI. The Bank of England’s chief economist, Spencer Dale, explained last week that the MPC expects real wages to turn positive in the second half of 2014. Pigs are already practising their take-off manoeuvres. We shall see, but the signs aren’t good that suddenly after five years of real declines it’s all change on the wage front.
Of course one of the major concerns is that there is a dividing line in the country somewhere around the Watford Gap. The unemployment rate in the North-east is 10 per cent and it is over 8 per cent in the North-west, Yorkshire and Humberside and the West Midlands and around 7 per cent in Wales, Scotland and Ireland. This contrasts sharply with 5.1 per cent in the South-east and 5.7 per cent in the East of England. The South is seeing recovery and the rest of the country is being left behind.
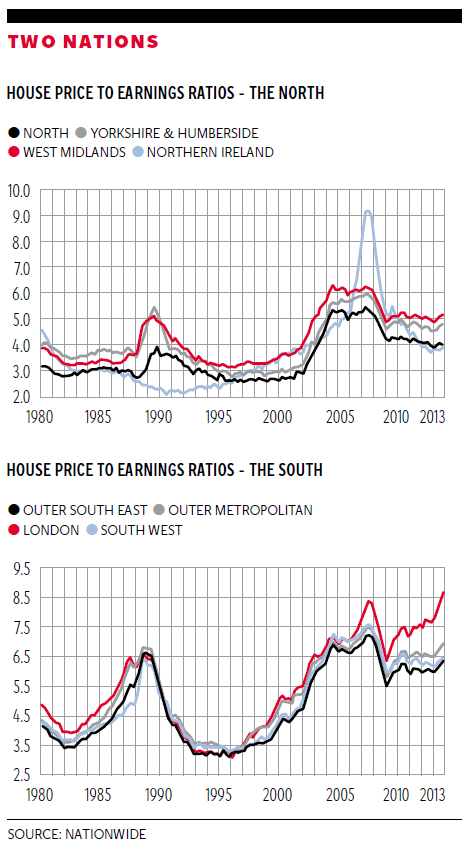
This is well illustrated by what is happening to the housing market, which is now in clear bubble territory in London and the South-east, with little sign of much house price growth elsewhere. Feelgood factor? Not here, mate. Now Kensington & Chelsea is another matter.
The two charts report data by regions on house price to earnings ratios, kindly provided to me by the Nationwide. They report estimates of the Nationwide measure of all house prices by area divided by gross mean earnings for adult full-time workers excluding bonuses. The overall average for the UK since 1960 is 4.14, with the national monthly average in December 2013 standing at 5.42, up from 5.02 a year ago.

The first chart reports estimates for the North. The huge growth through 2007 and then subsequent collapse in Northern Ireland is especially notable. It is also apparent that in all of these regions there has been little pick-up recently; the highest in Q42013 were the West Midlands (5.2), with the North being the lowest (4.0).
This is in direct contrast with what has happened in the southern regions, where there has been a dramatic pick-up, but most notably in London (8.7) and Outer Metropolitan London (6.9). In both of these cases the ratios are way above their long-run averages of 5.5 and 5.2 respectively. In the case of London this is a record high, well above the 8.3 observed in Q4 2007 at the peak of the boom; then the crash came. The evidence in the South is that the housing market is already in bubble territory, and what goes up must come down and with a bang, so stand clear. The rest of the country isn’t recovering.
In the latest YouGov/The Sun poll Labour has a 7 point lead. The Tories hold an 11 point lead in the South (excluding London), whereas Labour holds a 15 point lead in Scotland, a 22 point lead in the North, and a 9 point lead in the Midlands and Wales. Strikingly, the Tories hold a 9 point lead among those aged over 60, who are disproportionately home owners. Though over the last few months, as the economy has started to show signs of recovery, there has been virtually no movement in the polls, looking through the quite large day-to-day variation and noise. Between September and the end of the year Labour had a lead of 5.9 points averaged across 144 polls, compared with a lead of 5.7 points averaged across the 53 polls in 2014.
I much enjoyed reading a paper which crossed my desk last week by Whiteley, Clarke, Sanders and Stewart,* who examined the relationship between electoral support and the UK economy over the period 2004 to 2013. This involved modelling the relationship between voting intentions, perceptions of economic performance, and a variety of other variables using survey data collected each month from 2004. They found that when Labour was in office, support for the party was strongly influenced by the state of the economy, as was support for the opposition parties. However, since the Coalition came to power, the relationship between the economy and political support has changed, with neither the Conservatives nor the Liberal Democrats gaining from a fairly rapid growth in economic optimism which has taken place since early 2013. The authors explain this change in terms of a growing perception among the public that none of the major parties can effectively manage Britain’s economic problems. It is also the case, they suggest, that optimism about the national economy has not significantly percolated down to the level of the individual voter. It had better, or the Tories are electoral toast.
Whiteley and his co-authors conclude: “The Coalition Government is now almost entirely reliant on the return of economic optimism being translated into a ‘feel good’ factor at the level of the individual voter. It will not be able to take credit for economic recovery until real incomes start rising again for the average citizen. Part of the Coalition strategy for the election will be to try and convince voters that Labour was responsible for the recession, but … the force of this argument is weakening over time”. I bet the Tories’ electoral strategist Lynton Crosby will weep when he reads this paper.
*Paul Whiteley, Harold Clarke, David Sanders and Marianne Stewart: “The economic and electoral consequences of austerity policies in Britain” 2014
Join our commenting forum
Join thought-provoking conversations, follow other Independent readers and see their replies
Comments