Coronavirus: Space images reveal drastic fall in pollution over China as factories closed
‘This is the first time I have seen such a dramatic drop-off over such a wide area for a specific event,’ says Nasa scientist
Your support helps us to tell the story
From reproductive rights to climate change to Big Tech, The Independent is on the ground when the story is developing. Whether it's investigating the financials of Elon Musk's pro-Trump PAC or producing our latest documentary, 'The A Word', which shines a light on the American women fighting for reproductive rights, we know how important it is to parse out the facts from the messaging.
At such a critical moment in US history, we need reporters on the ground. Your donation allows us to keep sending journalists to speak to both sides of the story.
The Independent is trusted by Americans across the entire political spectrum. And unlike many other quality news outlets, we choose not to lock Americans out of our reporting and analysis with paywalls. We believe quality journalism should be available to everyone, paid for by those who can afford it.
Your support makes all the difference.Satellite images show a dramatic drop in pollution over China after the coronavirus outbreak shut down swathes of the country’s industry and travel.
US space agency Nasa said the change was at least partly related to the economic slowdown caused by efforts to contain the virus.
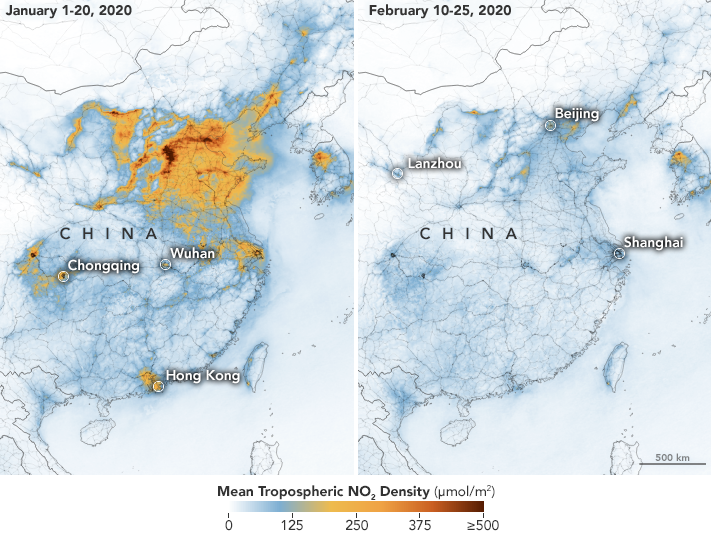
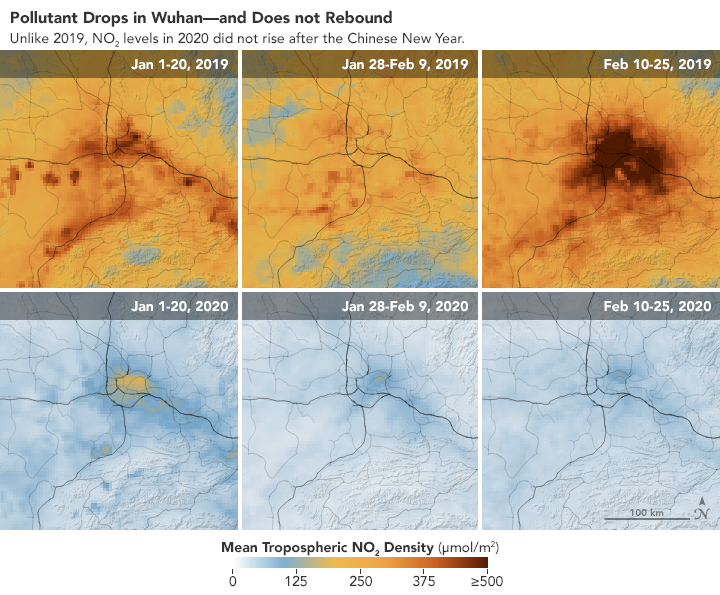
Nasa maps show how levels of nitrogen dioxide, a toxic gas from vehicles, power plants and factories, plummeted after the mass quarantine, compared with before.
Scientists have previously found the coronavirus wiped out at least a quarter of China’s emissions of damaging greenhouse gases in just two weeks in mid-February.
Closing industrial plants and asking people to stop at home has led to sharp drops in the burning of fossil fuels — a key cause of the climate crisis — in the world’s largest greenhouse gas producer.

China, where the outbreak began, has nearly 80,000 cases of coronavirus, by far the largest number of any country, with nearly 2,900 deaths.
Nasa’s maps compare pollution levels between the first three weeks of the year and 10-25 February.
The space agency’s scientists said the fall in pollution was first apparent near Wuhan, the source of the outbreak, but eventually spread across the country.
“This is the first time I have seen such a dramatic drop-off over such a wide area for a specific event,” said Fei Liu, an air quality researcher at Nasa’s Goddard Space Flight Centre.
She said she had seen a decline in nitrogen dioxide levels during the economic recession of 2008 but said that decrease was more gradual.


Join our commenting forum
Join thought-provoking conversations, follow other Independent readers and see their replies
Comments