Istanbul revealed as the most congested city in the world
TomTom’s annual Traffic Index explores traffic congestion in over 200 cities around the world and ranks a total of 146 cities
Your support helps us to tell the story
From reproductive rights to climate change to Big Tech, The Independent is on the ground when the story is developing. Whether it's investigating the financials of Elon Musk's pro-Trump PAC or producing our latest documentary, 'The A Word', which shines a light on the American women fighting for reproductive rights, we know how important it is to parse out the facts from the messaging.
At such a critical moment in US history, we need reporters on the ground. Your donation allows us to keep sending journalists to speak to both sides of the story.
The Independent is trusted by Americans across the entire political spectrum. And unlike many other quality news outlets, we choose not to lock Americans out of our reporting and analysis with paywalls. We believe quality journalism should be available to everyone, paid for by those who can afford it.
Your support makes all the difference.“Sometimes when we’re stuck in traffic we think it’s never going to end and never going to get better,” George Slavich, assistant professor of psychiatry and biobehavioral sciences at UCLA told the Los Angeles Times back in 2011. That’s when he was offering commuters strategies to cope with Los Angeles’s 2011 “Carmageddon,” where the media hyped the weekend closure of 10 miles of the 405 Freeway into a major calamity. “We sort of ‘catastrophise’ the situation,” Slavich said, “we take a situation that is relatively limited and we think it’s the worst it’s ever been.”
“Carmageddon” was not as bad as expected, but every day of the work week is pretty miserable if you’re driving in L.A. According to a newly released data from GPS maker TomTom, Los Angeles ranked No. 10 for most congested cites in world last year. The company found that a 30 minute commute in the evening took 54 minutes because of congestion, for a total of 92 hours of extra driving annually.
But Angelenos should consider themselves lucky they’re not in Istanbul or Mexico City.
TomTom’s annual Traffic Index explores traffic congestion in over 200 cities around the world and ranks a total of 146 cities. The data revealed that the average commuter last year traveled an extra 100 hours during the evening rush hour alone.
Here’s TomTom’s top ten:
Istanbul
Congestion Level: 58%
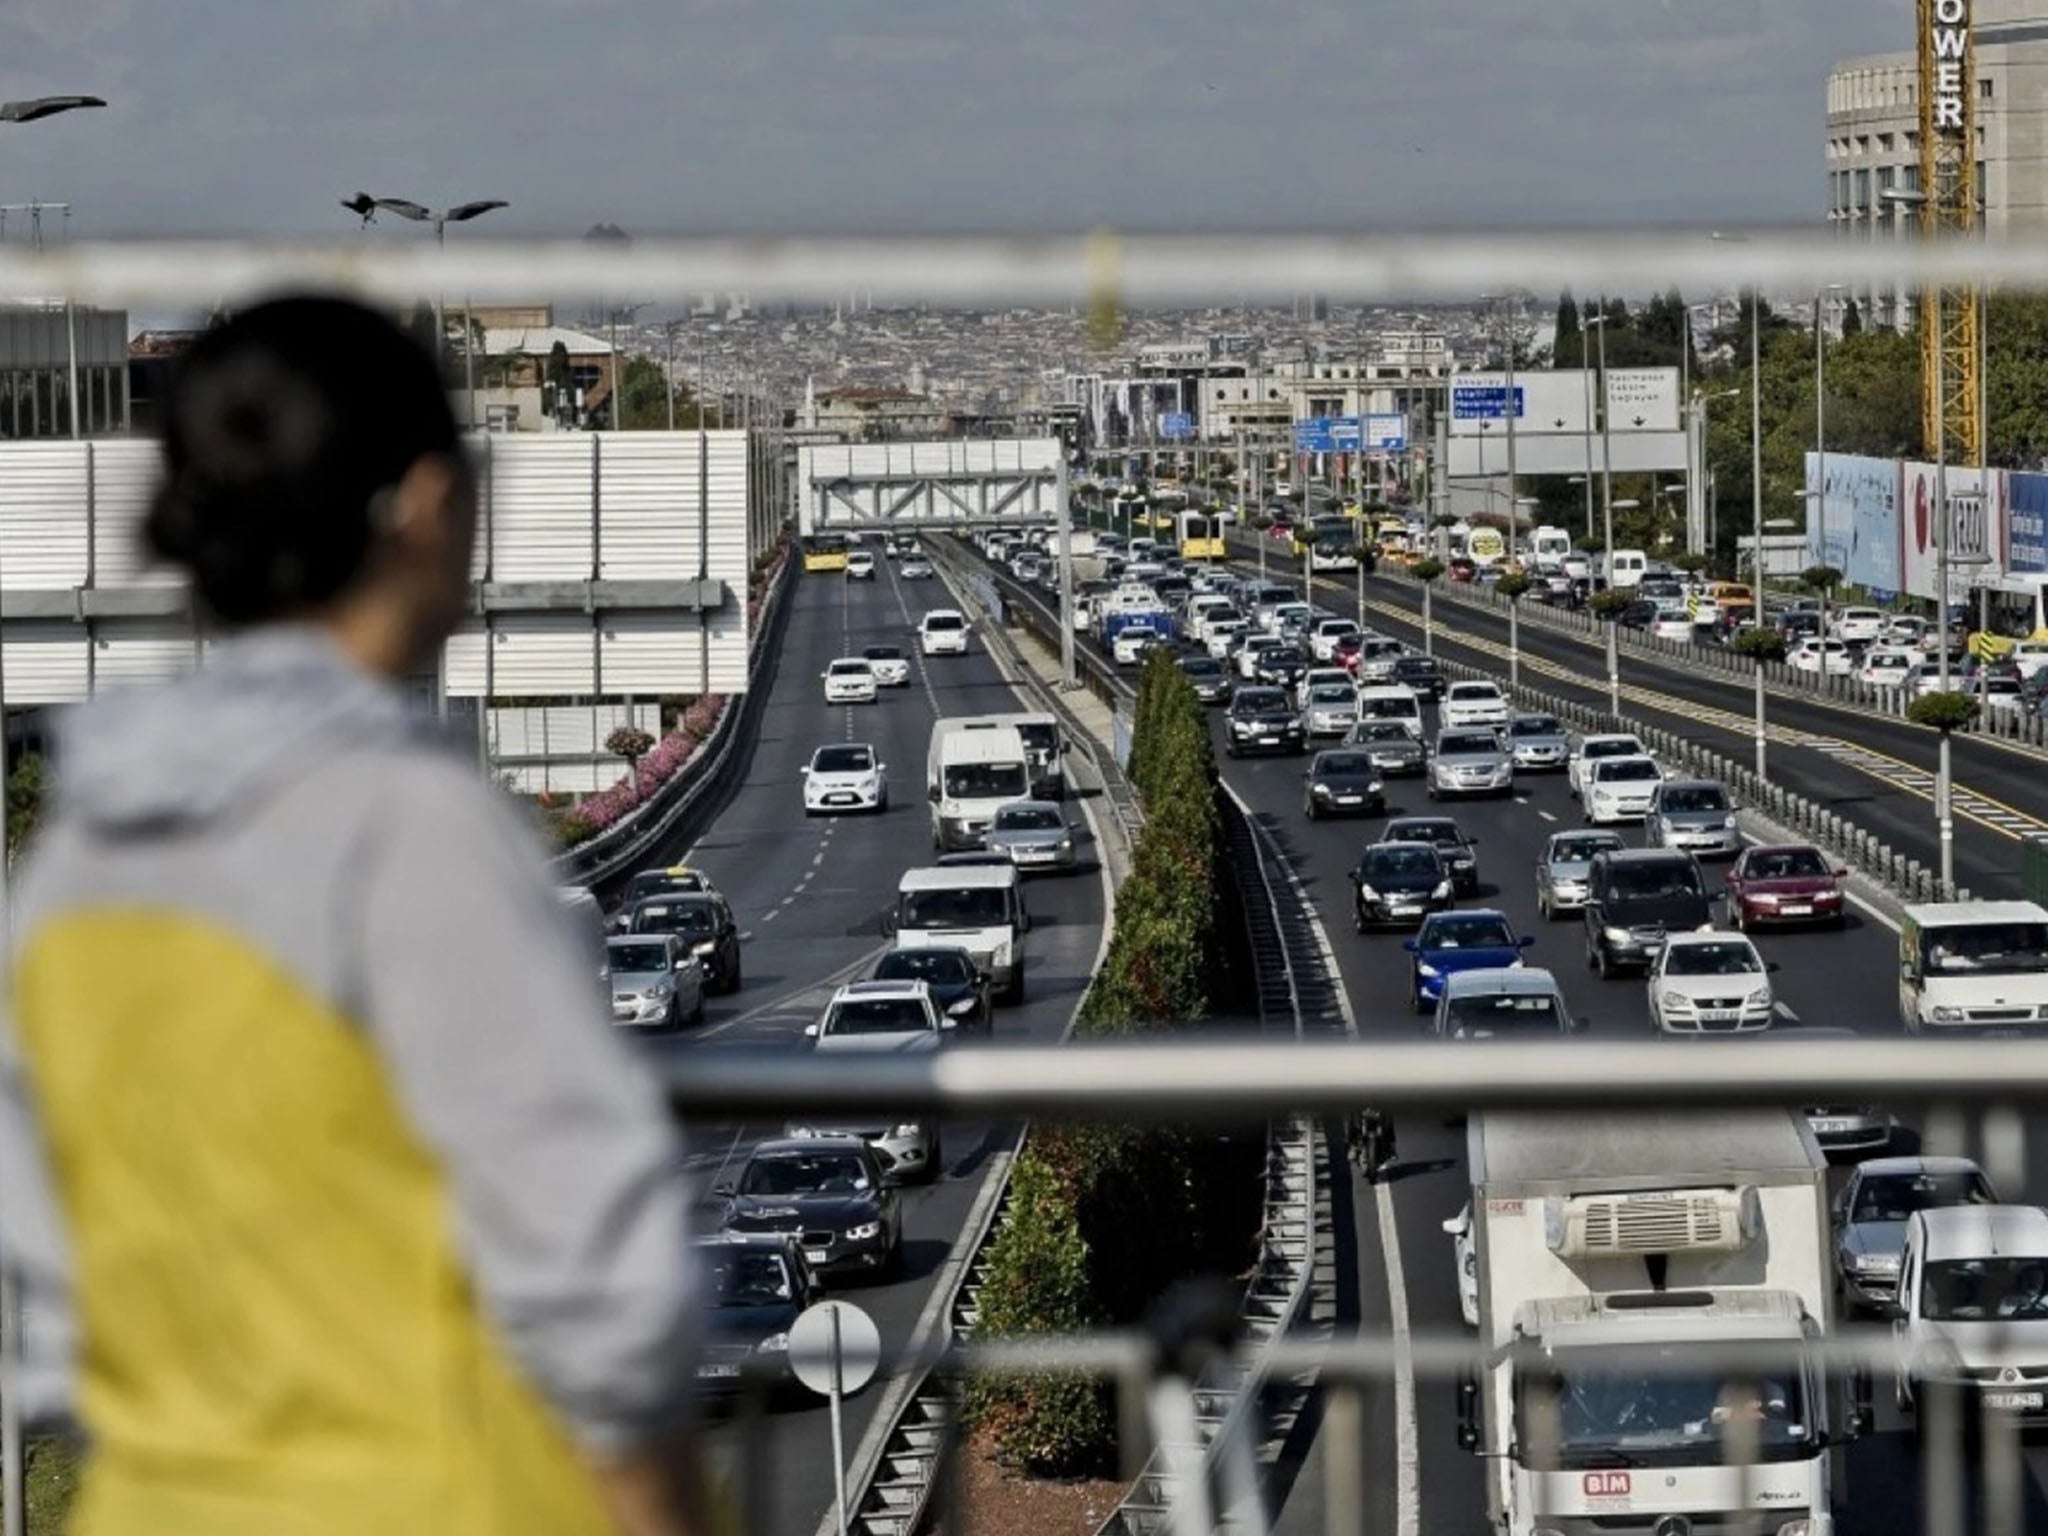
TomTom writes: “Commuters in Istanbul experience the worst traffic congestion overall, the evening rush hour is no exception. The average 30 minute drive in the city will take over an hour during evening rush hour, leading to an extra 125 hours wasted stuck in traffic every year.”
World rank compared to other large cities 1/146
Congestion Level on highways 79%
Congestion Level on non-highways 50%
Delay per day with a 30 min commute 29 min
Delay per year with a 30 min commute 110 hr
Most congested specific day Fri, Jul 25, 2014
Total network length 11,230 mi
Total network length highways 249 mi
Total network length non-highways 10,981 mi
Total vehicle distance 91,364 773 mi
Mexico City
Congestion Level: 55%
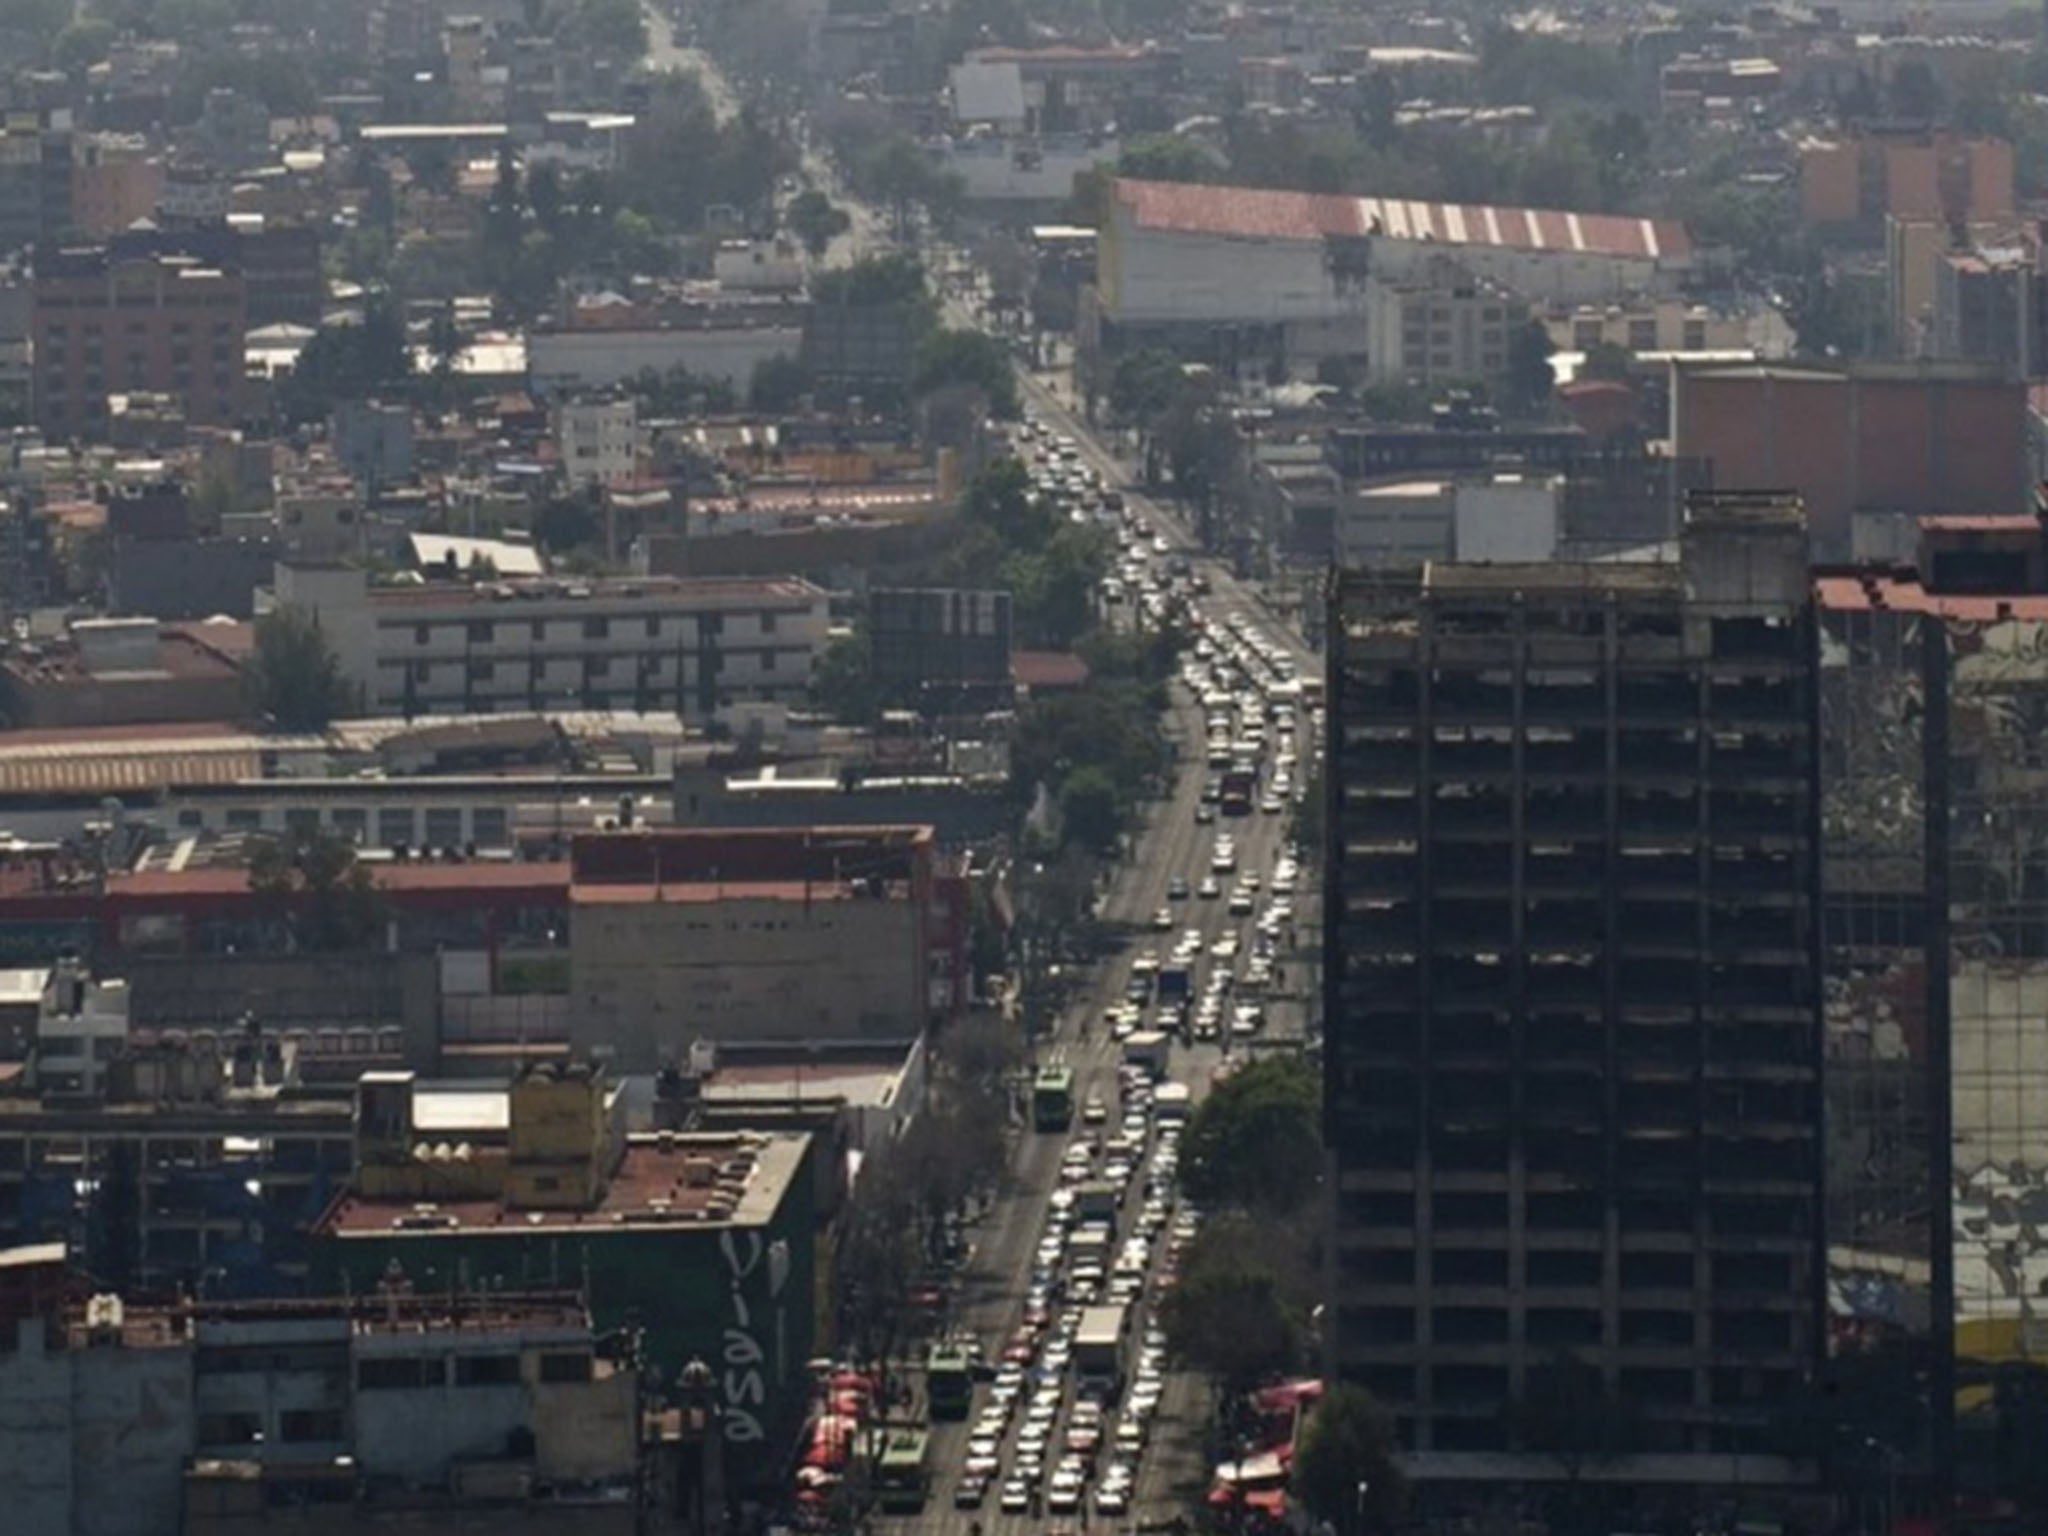
World rank compared to other large cities 2/146
Congestion Level on highways 46%
Congestion Level on non-highways 59%
Delay per day with a 30 min commute 29 min
Delay per year with a 30 min commute 110 hr
Most congested specific day Fri, Oct 10, 2014
Total network length 32,982 mi
Total network length highways 605 mi
Total network length non-highways 32,376 mi
Total vehicle distance 1,020,838 mi
Rio de Janeiro
Congestion Level: 51%
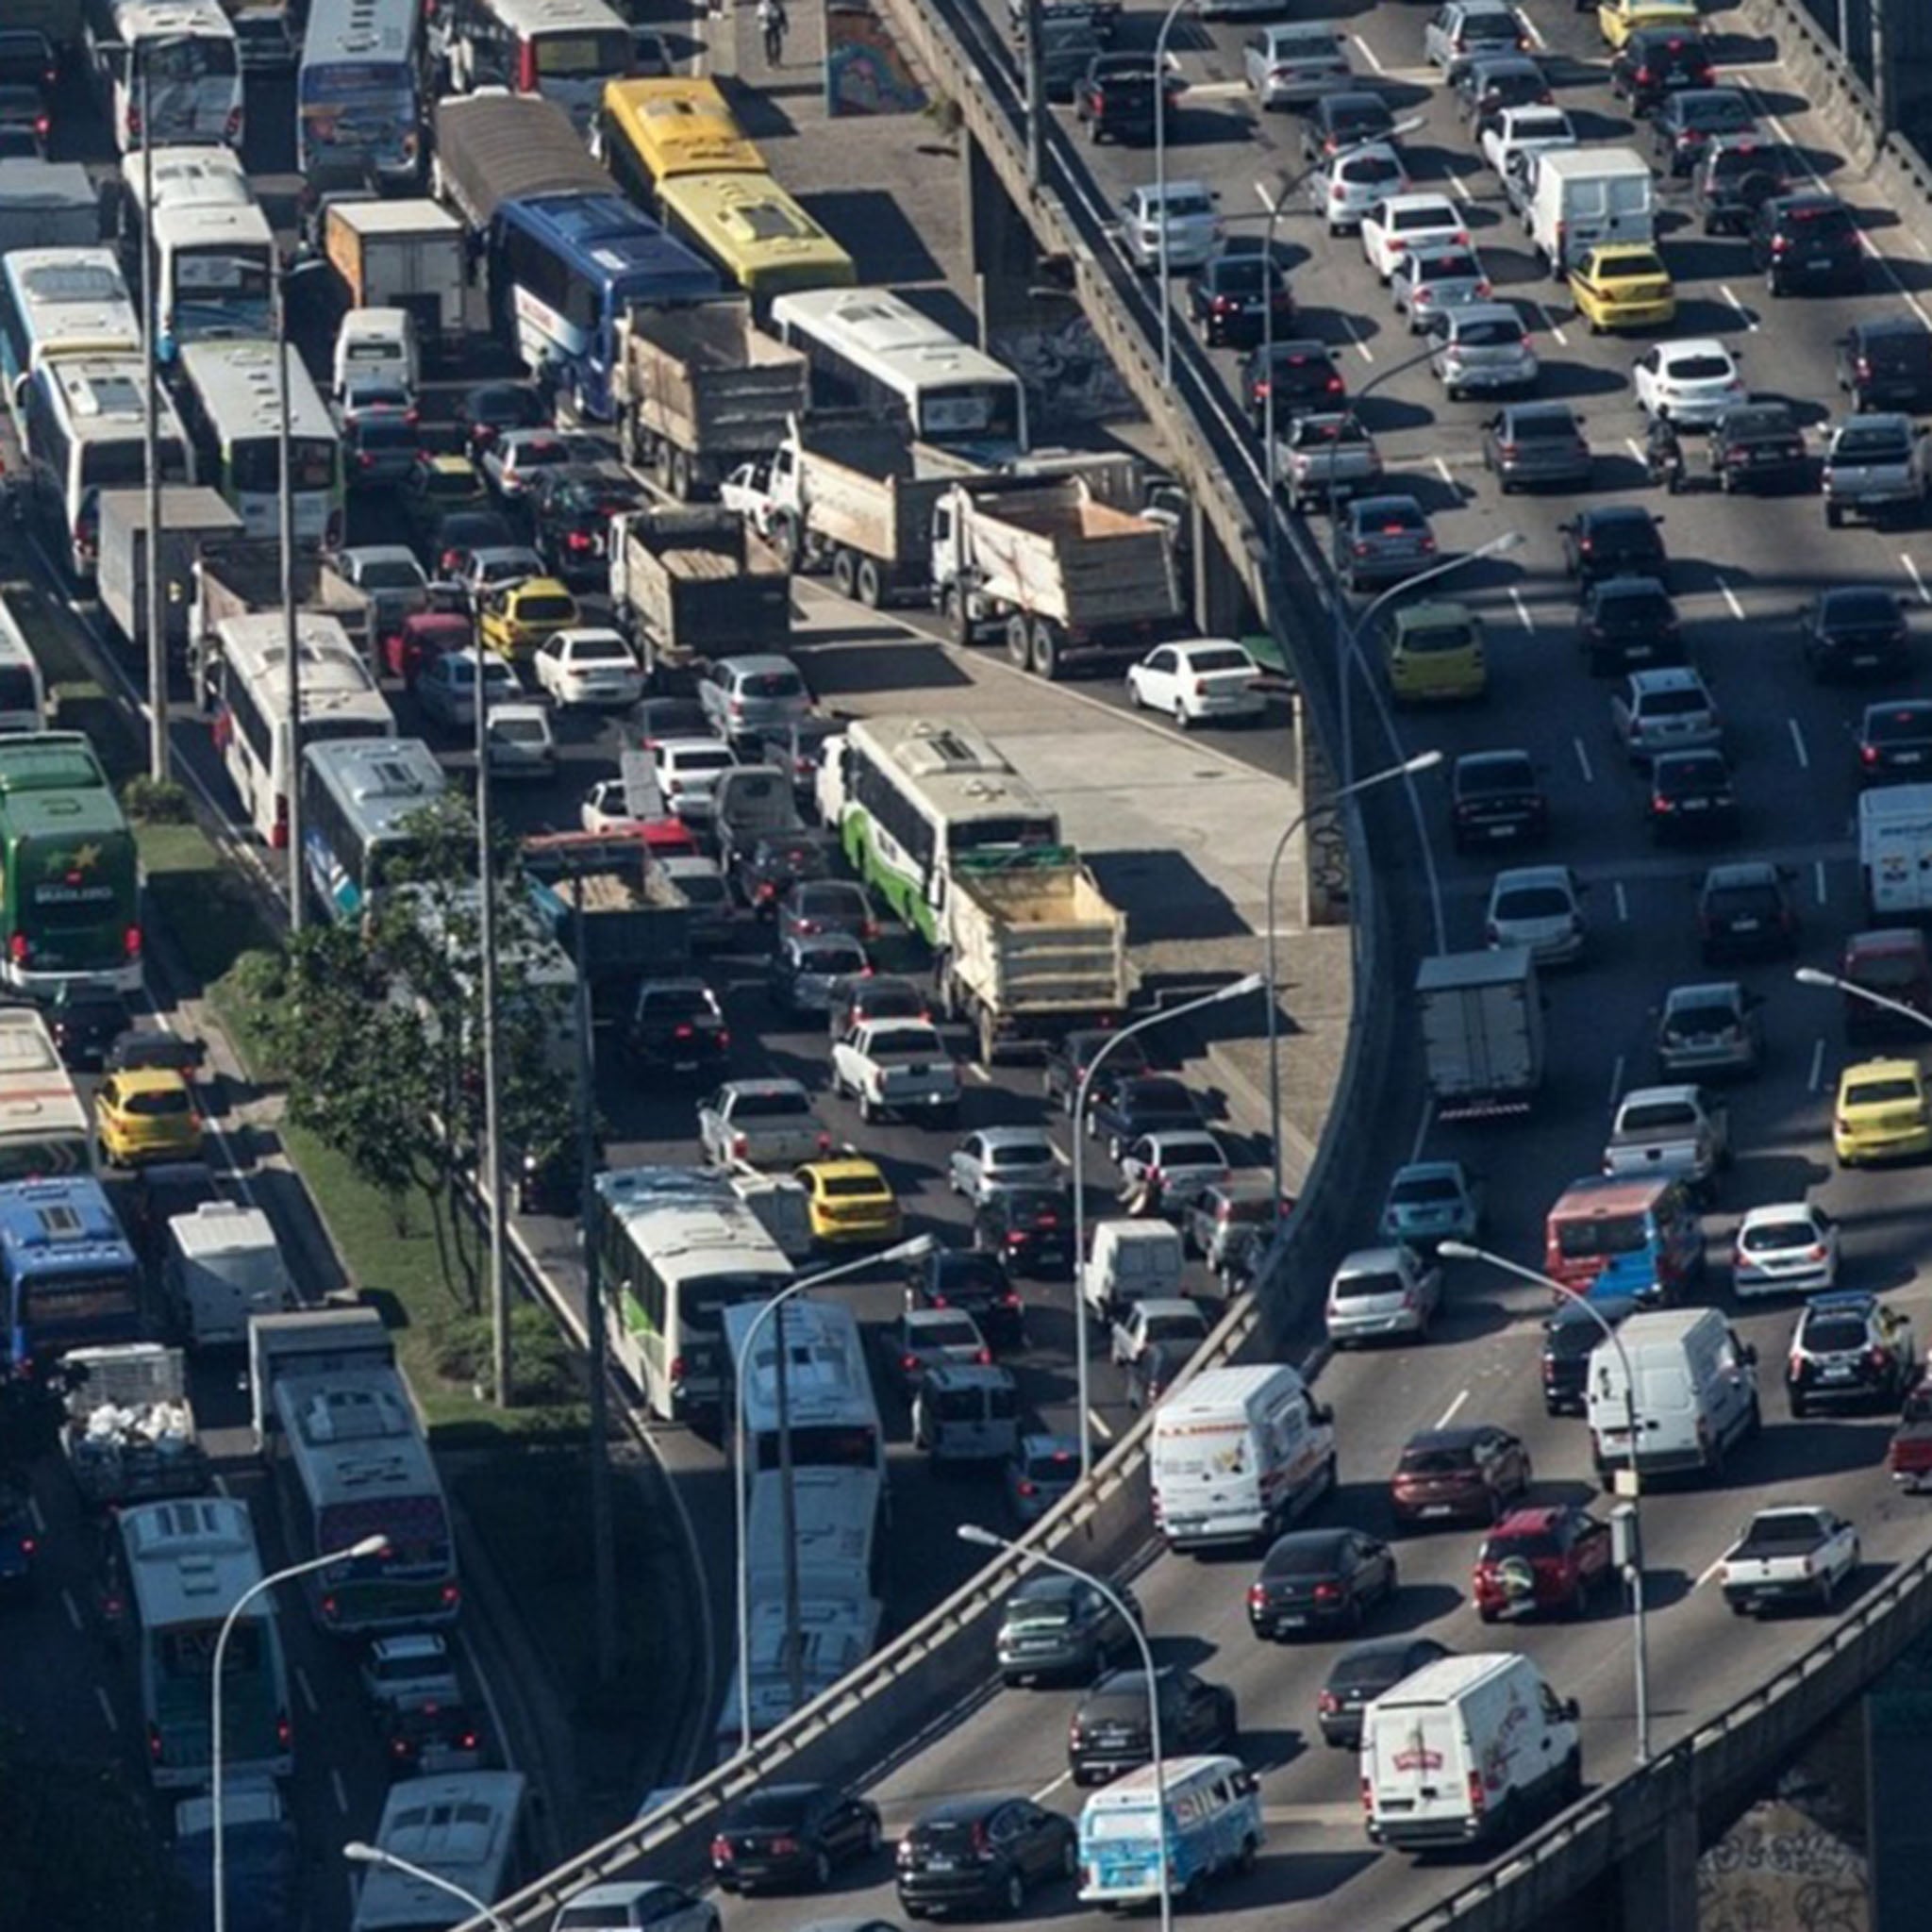
World rank compared to other large cities 3/146
Congestion Level on highways 49%
Congestion Level on non-highways 52%
Delay per day with a 30 min commute 26 min
Delay per year with a 30 min commute 99 hr
Most congested specific day Tue, Dec 23, 2014
Total network length 12,197 mi
Total network length highways 122 mi
Total network length non-highways 12,075 mi
Total vehicle distance 15,611,815 mi
Moscow
Congestion Level: 50%
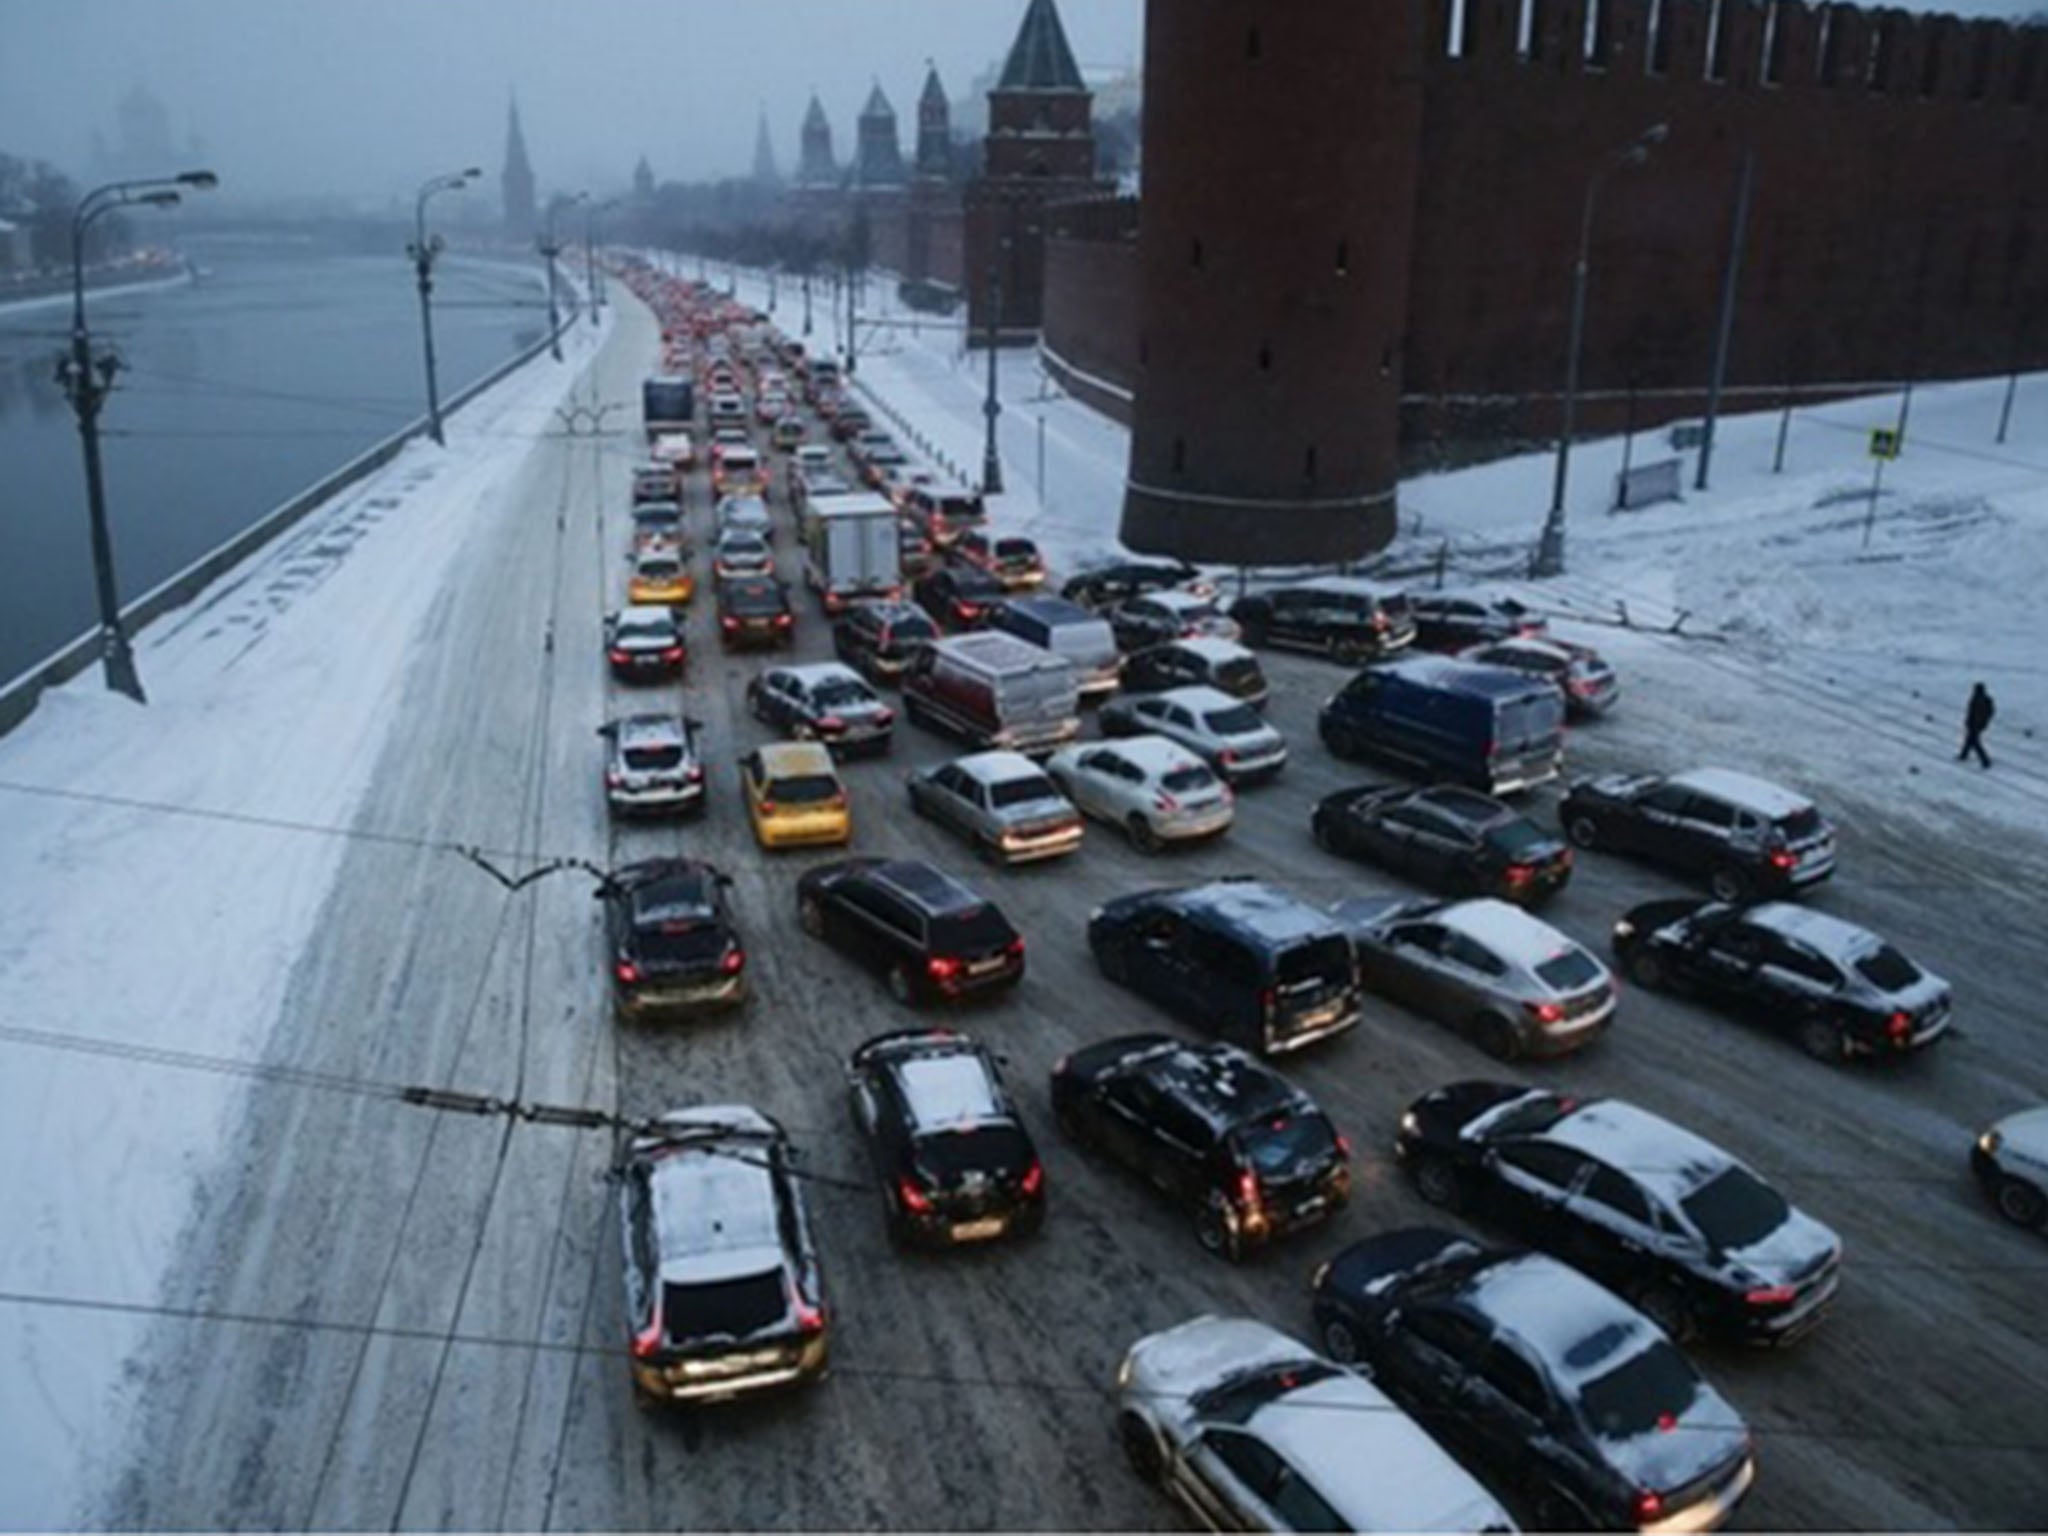
World rank compared to other large cities 4/146
Congestion Level on highways 67%
Congestion Level on non-highways 45%
Delay per day with a 30 min commute 29 min
Delay per year with a 30 min commute 109 hr
Most congested specific day Thu 25 Dec 2014
Total network length 22,324 mi
Total network length highways 231 mi
Total network length non-highways 22,093 mi
Total vehicle distance 231,398,727 mi
Salvador, Brazil
Congestion Level: 46%

World rank compared to other large cities 5/146
Congestion Level on highways 33%
Congestion Level on non-highways 50%
Delay per day with a 30 min commute 24 min
Delay per year with a 30 min commute 93 hr
Most congested specific day Wed Nov 12, 2014
Total network length 2,375 mi
Total network length highways 30 mi
Total network length non-highways 2,346 mi
Total vehicle distance 2,084,186 mi
Recife, Brazil
Congestion Level: 45%
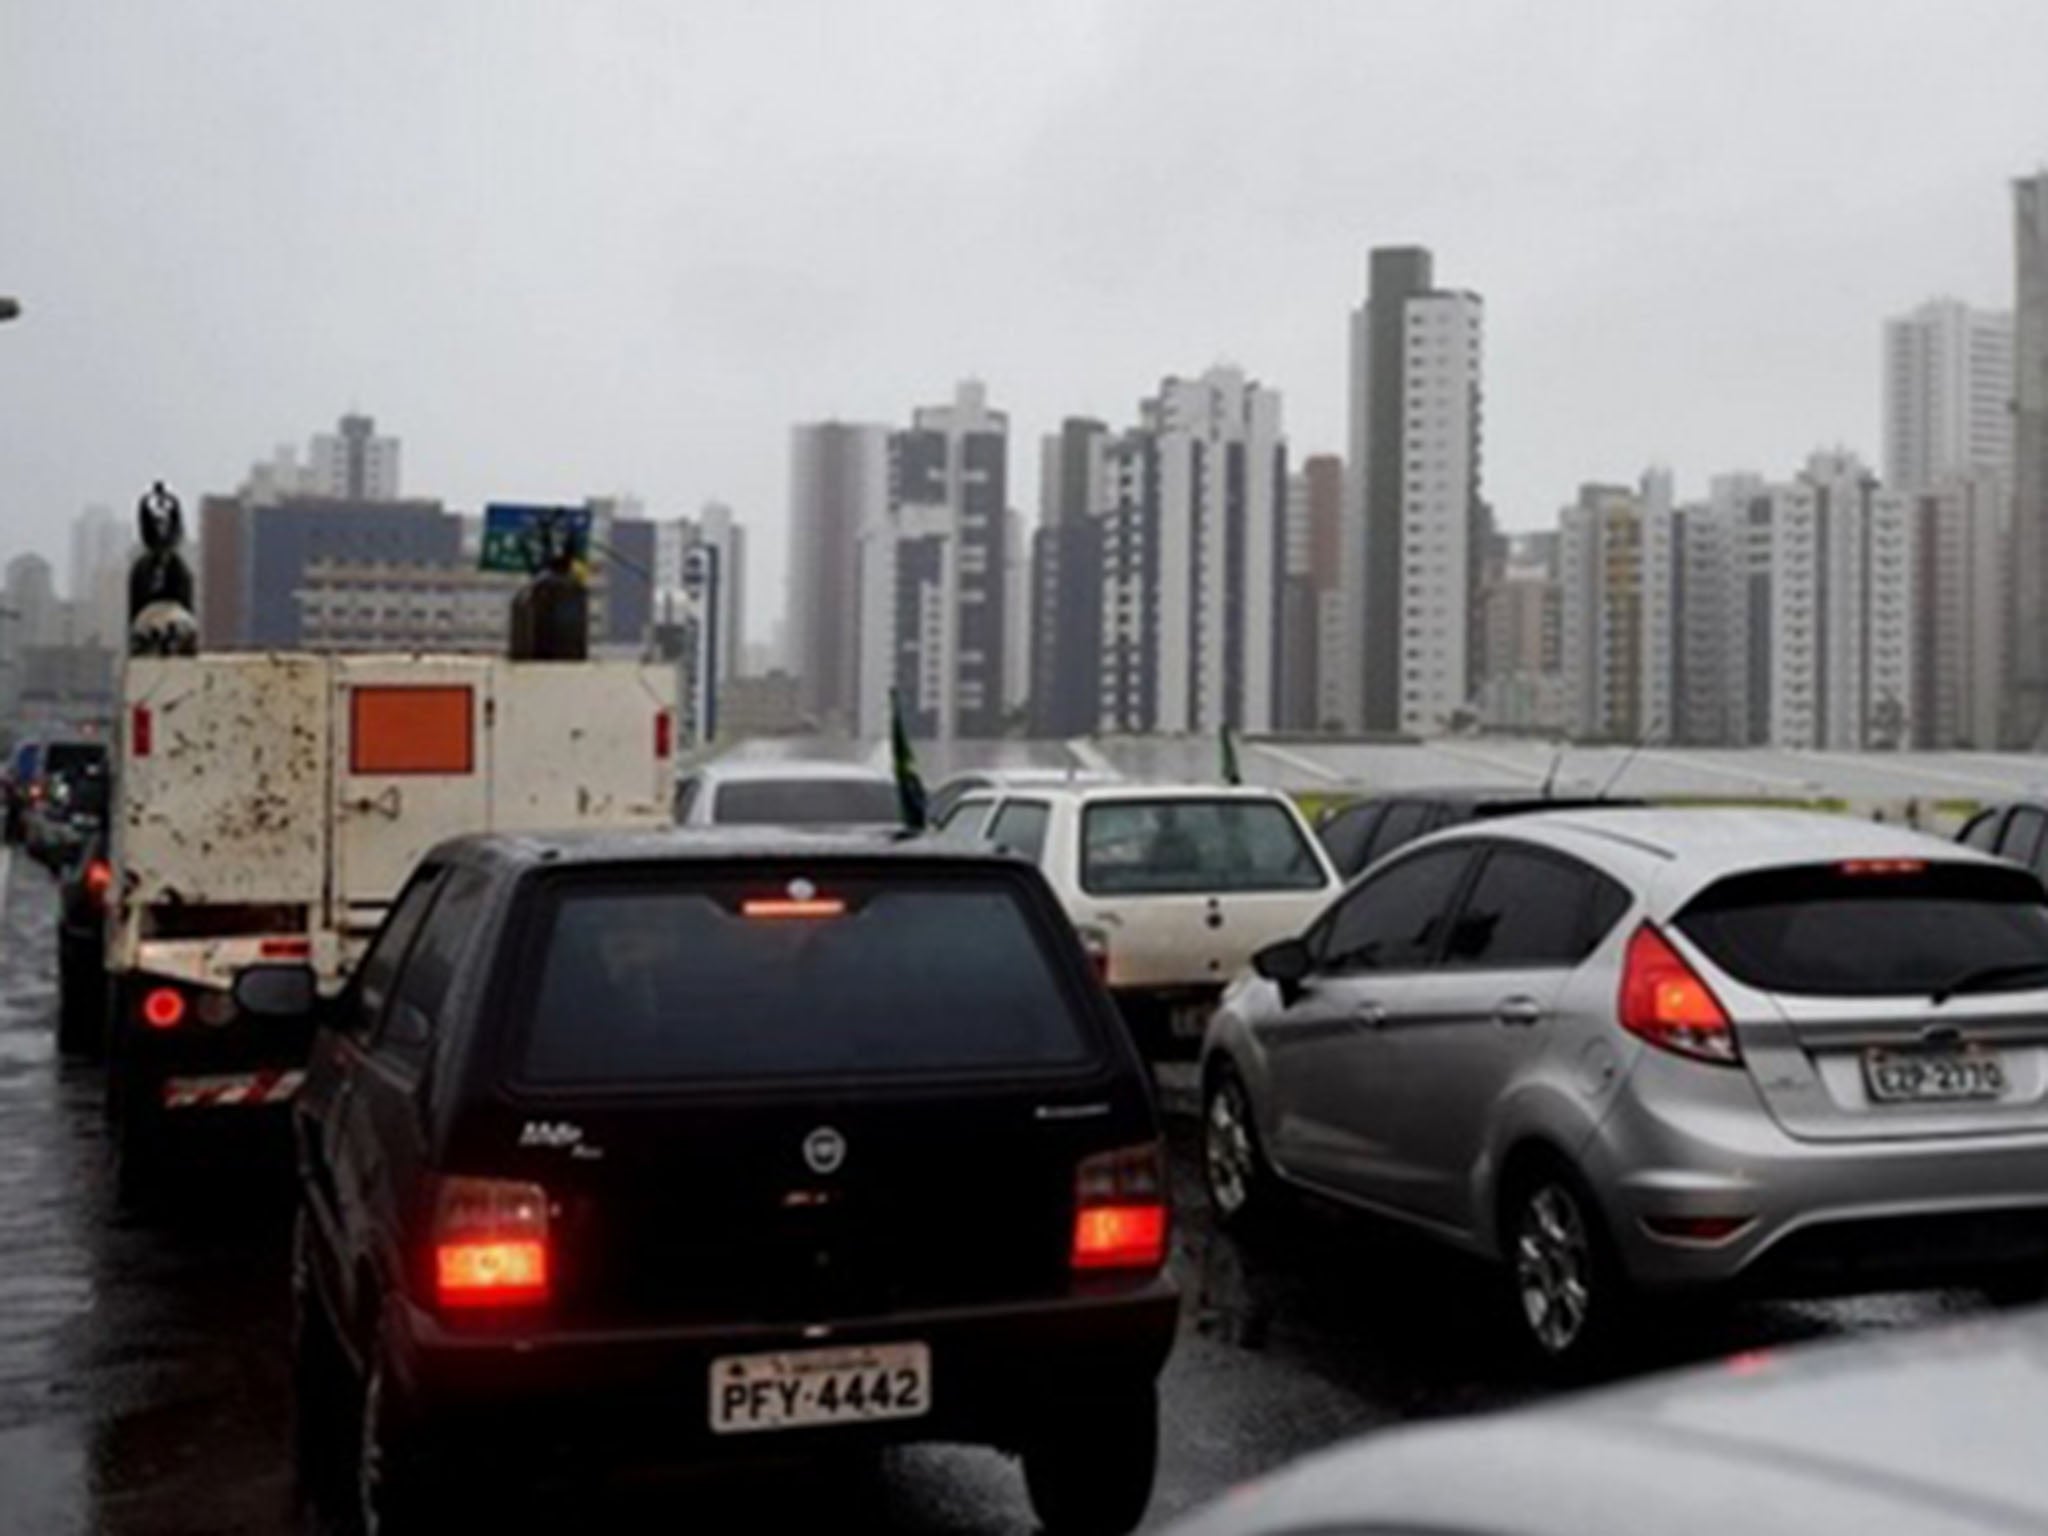
World rank compared to other large cities 6/146
Congestion Level on highways 37%
Congestion Level on non-highways 55%
Delay per day with a 30 min commute 27 min
Delay per year with a 30 min commute 103 hr
Most congested specific day Fri Nov, 28 2014
Total network length 4,854 mi
Total network length highways 80 mi
Total network length non-highways 4,774 mi
Total vehicle distance 2,684,900 mi
St. Petersburg
Congestion Level: 44%
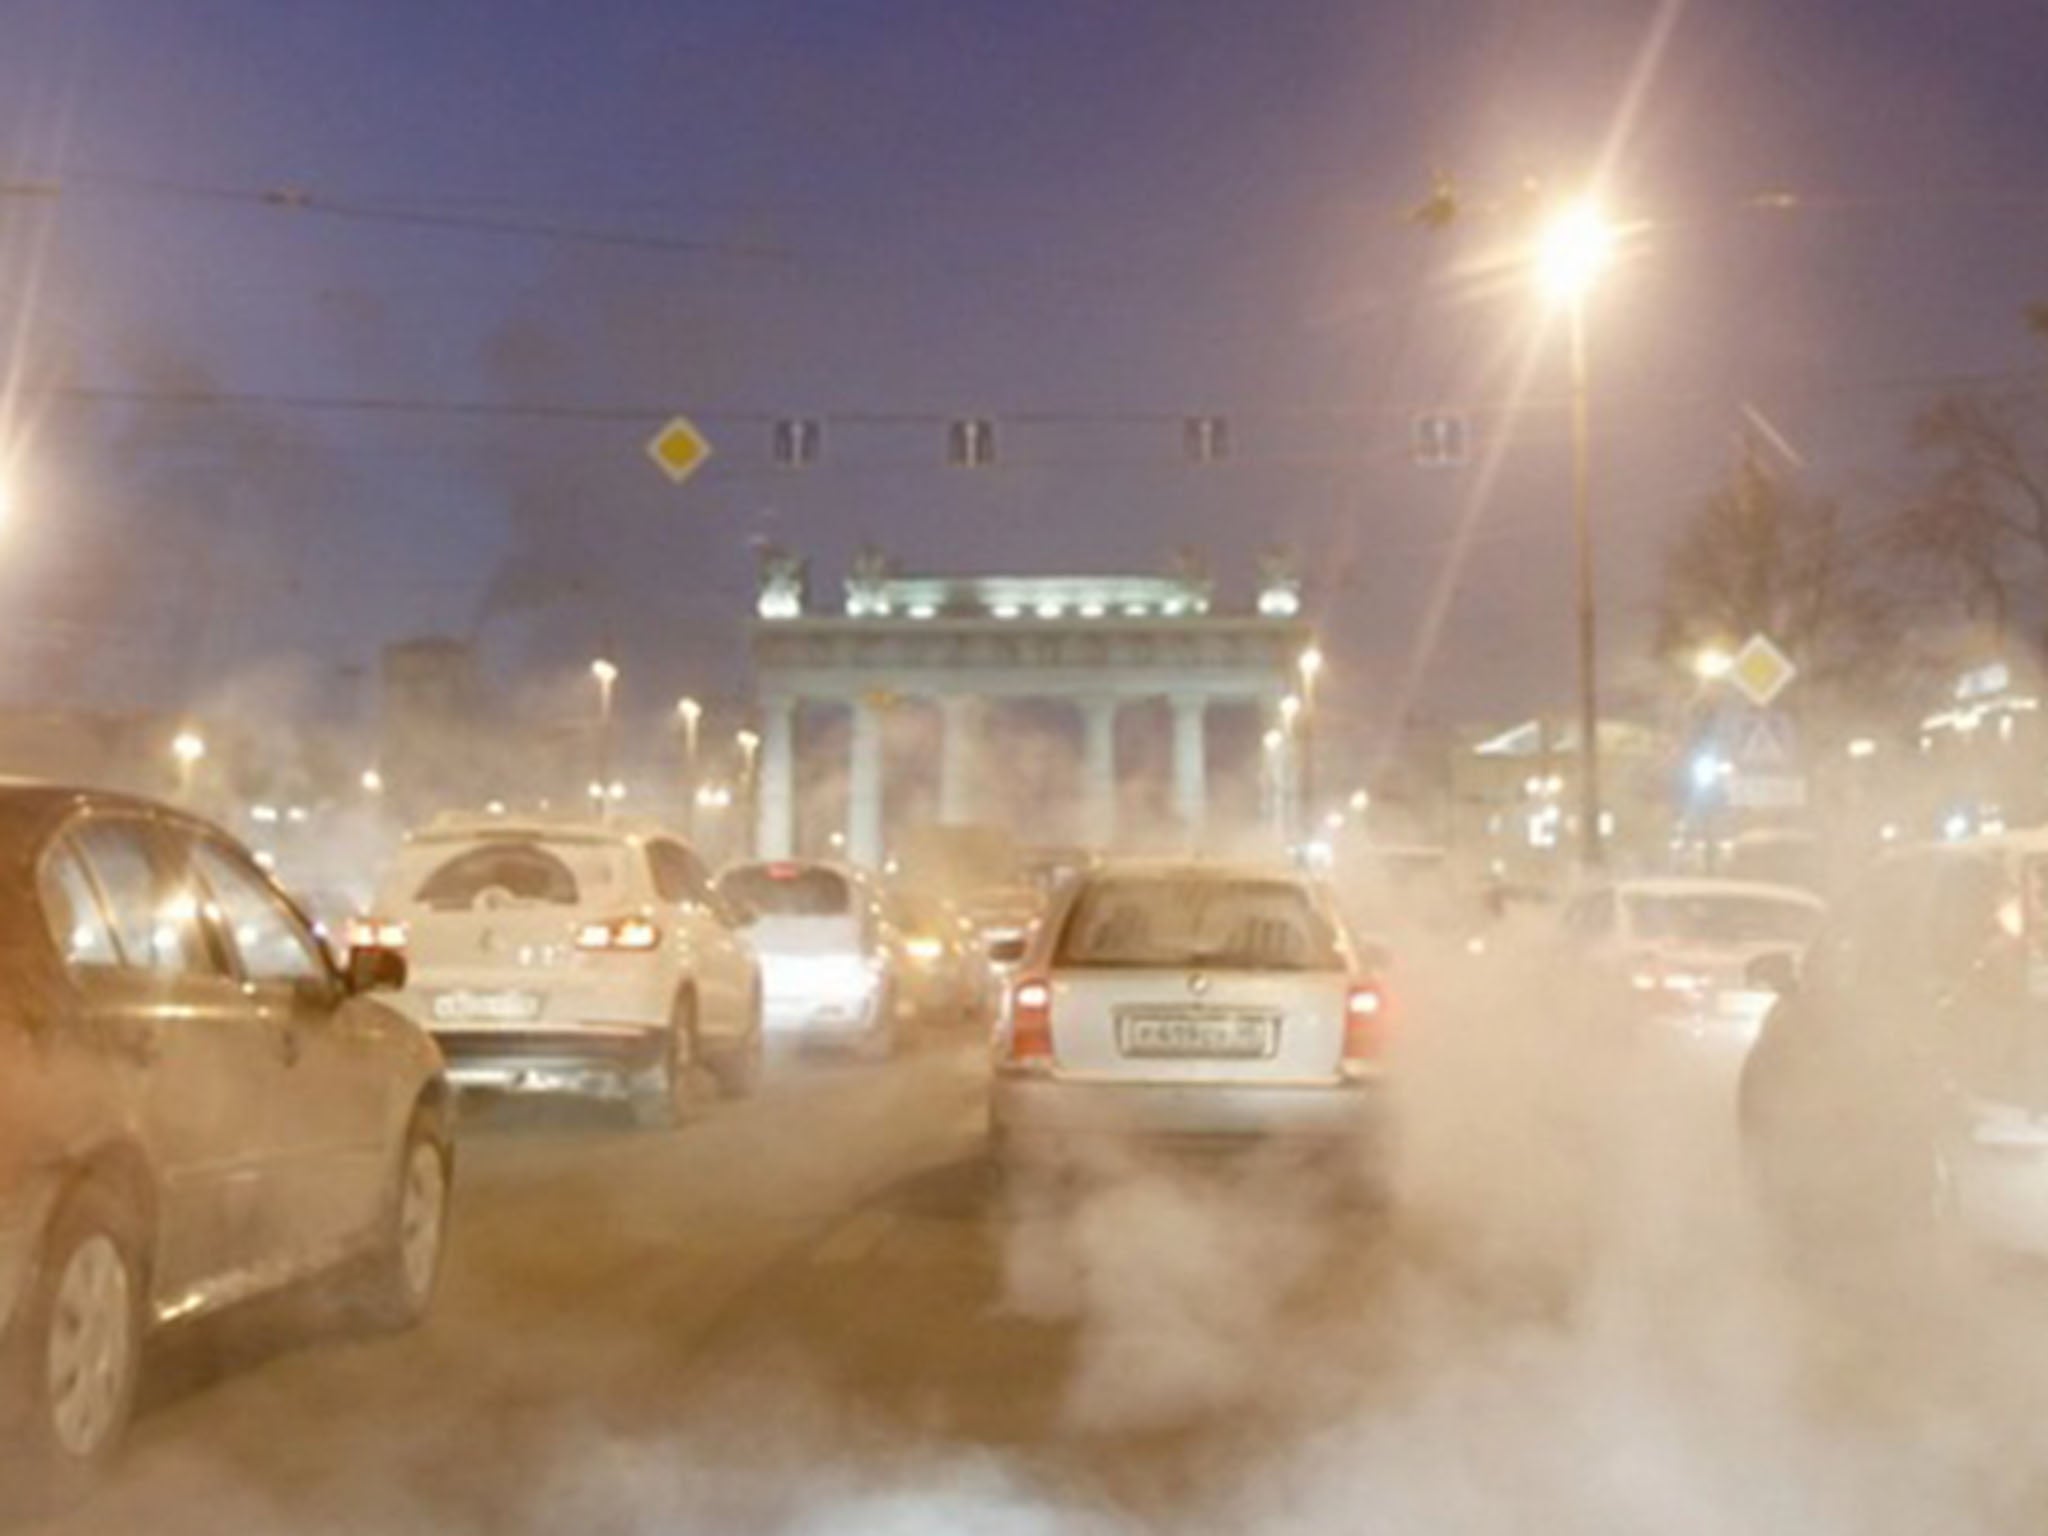
World rank compared to other large cities 7/146
Congestion Level on highways 25%
Congestion Level on non-highways 46%
Delay per day with a 30 min commute 27 min
Delay per year with a 30 min commute 104 hr
Most congested specific day Thu Dec 25, 2014
Total network length 6,782 mi
Total network length highways 87 mi
Total network length non-highways 6,695 mi
Total vehicle distance 43,824,320 mi
Bucharest, Romania
Congestion Level: 41%
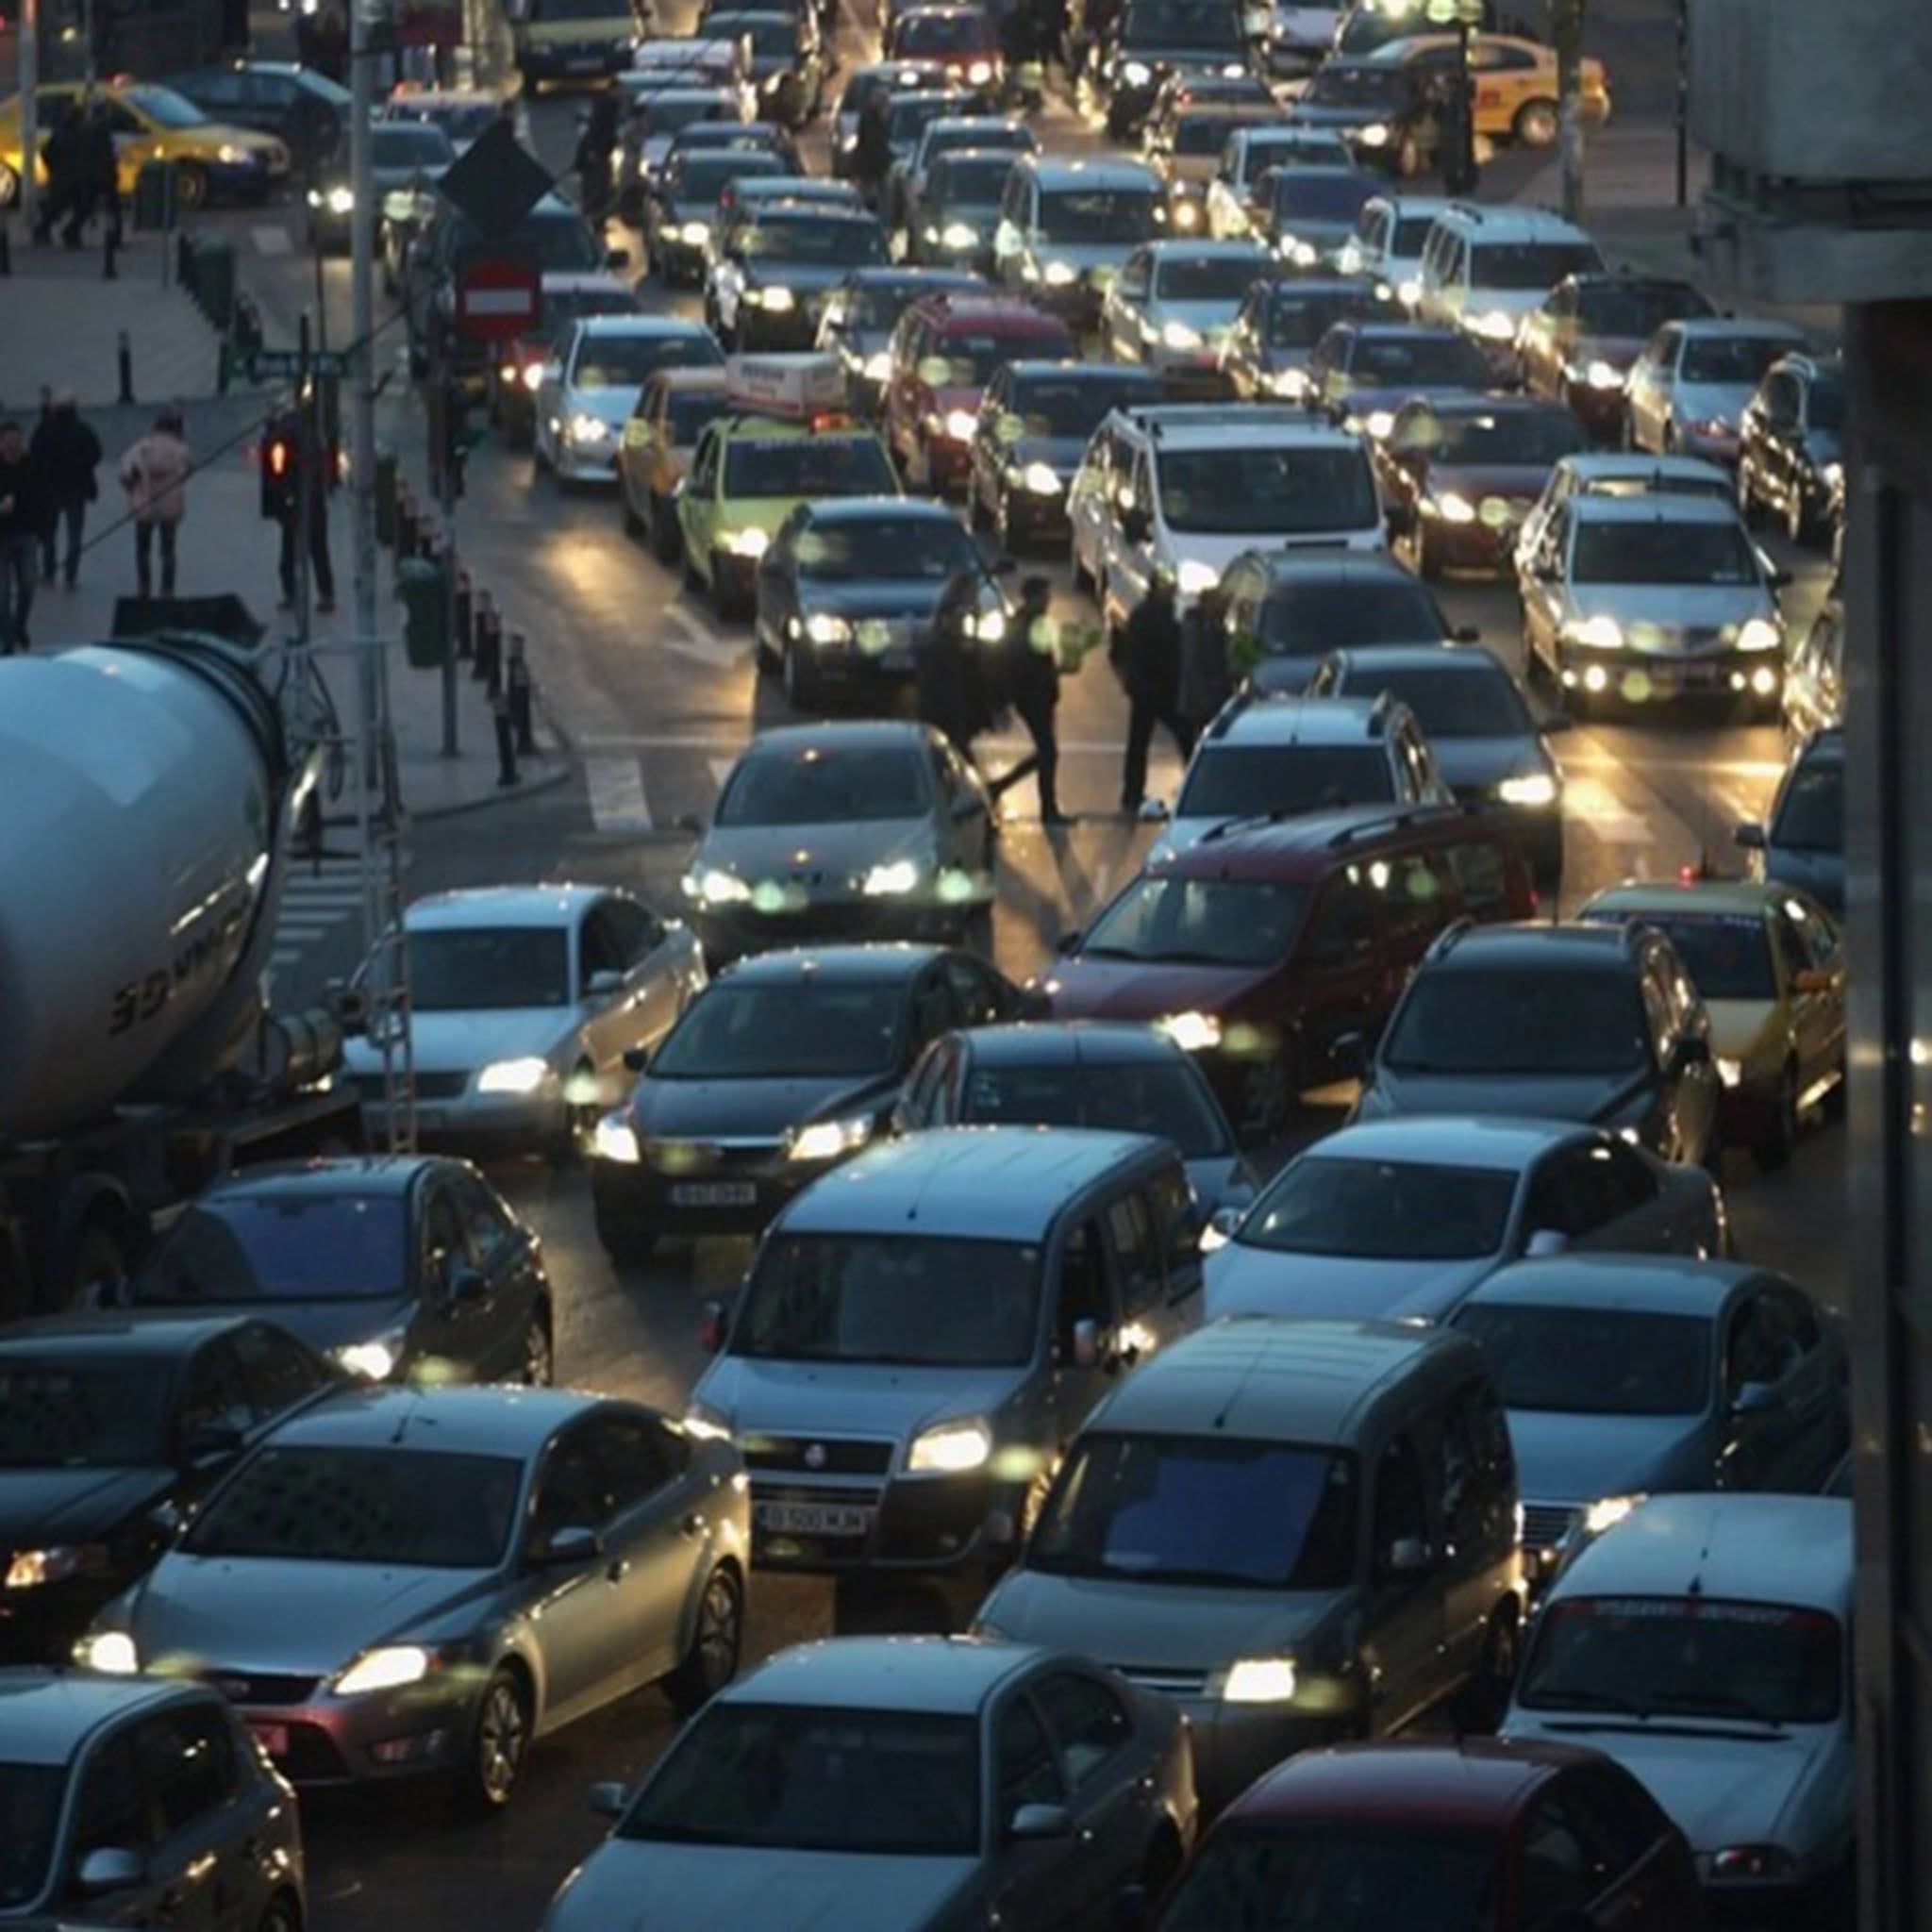
World rank compared to other large cities 8/146
Congestion Level on highways 28%
Congestion Level on non-highways 45%
Delay per day with a 30 min commute 27 min
Delay per year with a 30 min commute 103 hr
Most congested specific day Fri 28 Nov 2014
Total network length 3,775 mi
Total network length highways 100 mi
Total network length non-highways 3,675 mi
Total vehicle distance 632,222 mi
Warsaw
Congestion Level: 40%
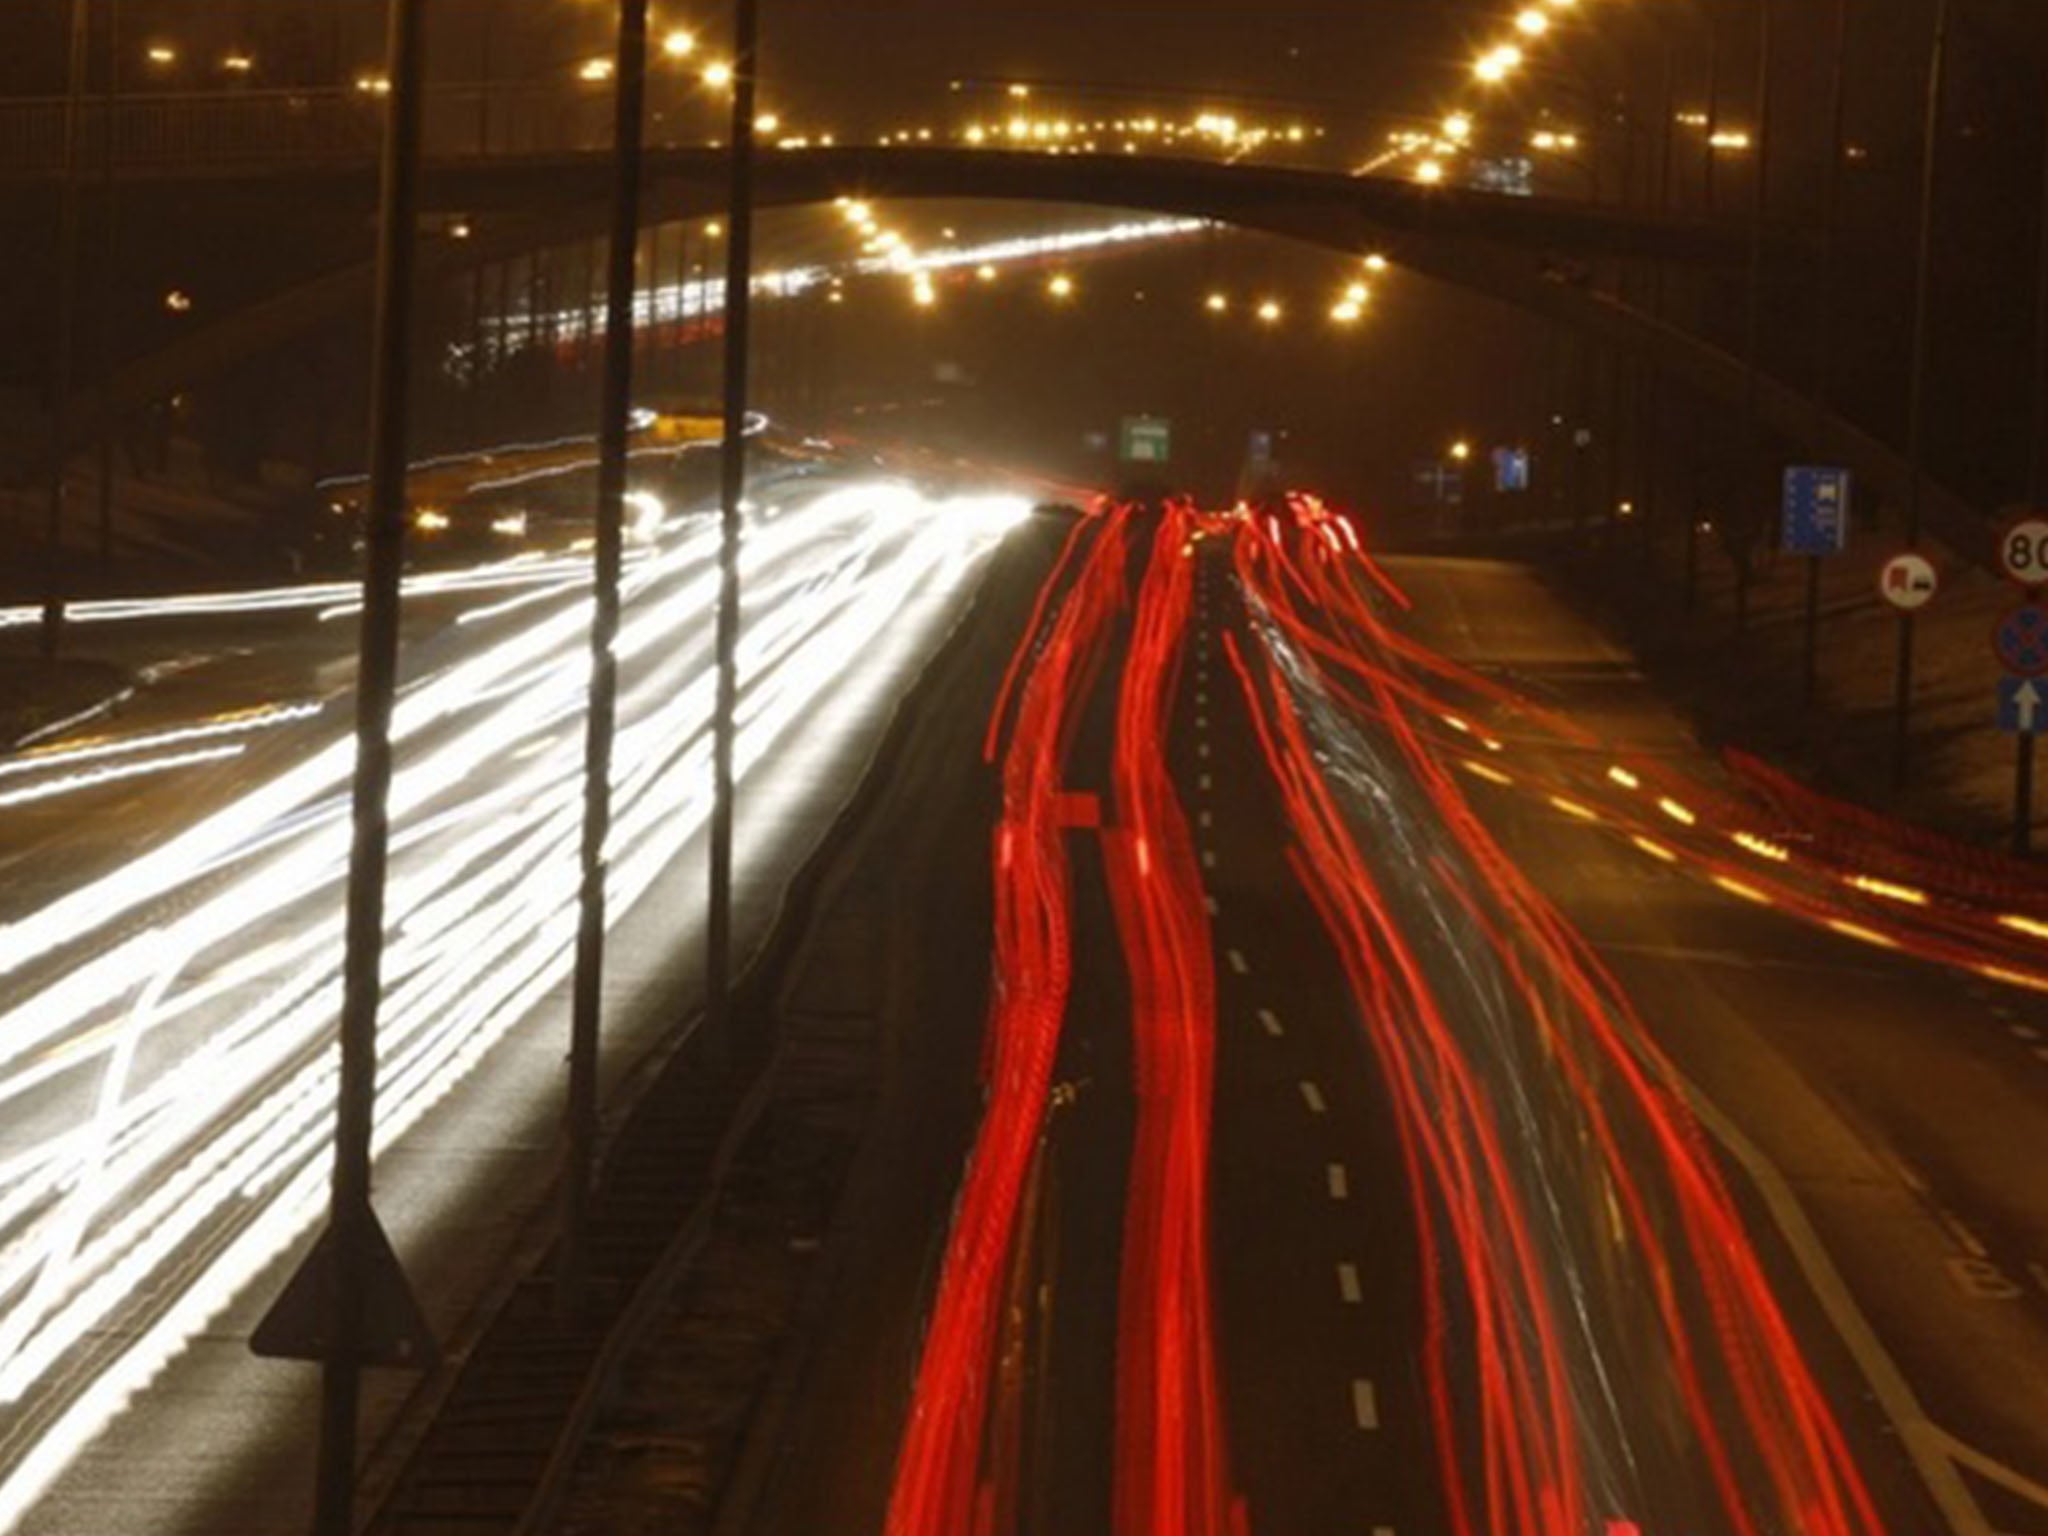
World rank compared to other large cities 9/146
Congestion Level on highways 37%
Congestion Level on non-highways 42%
Delay per day with a 30 min commute 25 min
Delay per year with a 30 min commute 96 hr
Most congested specific day Fri Dec 19, 2014
Total network length 4,772 mi
Total network length highways 222 mi
Total network length non-highways 4,550 mi
Total vehicle distance 8,615,724 mi
Los Angeles
Congestion Level: 39%
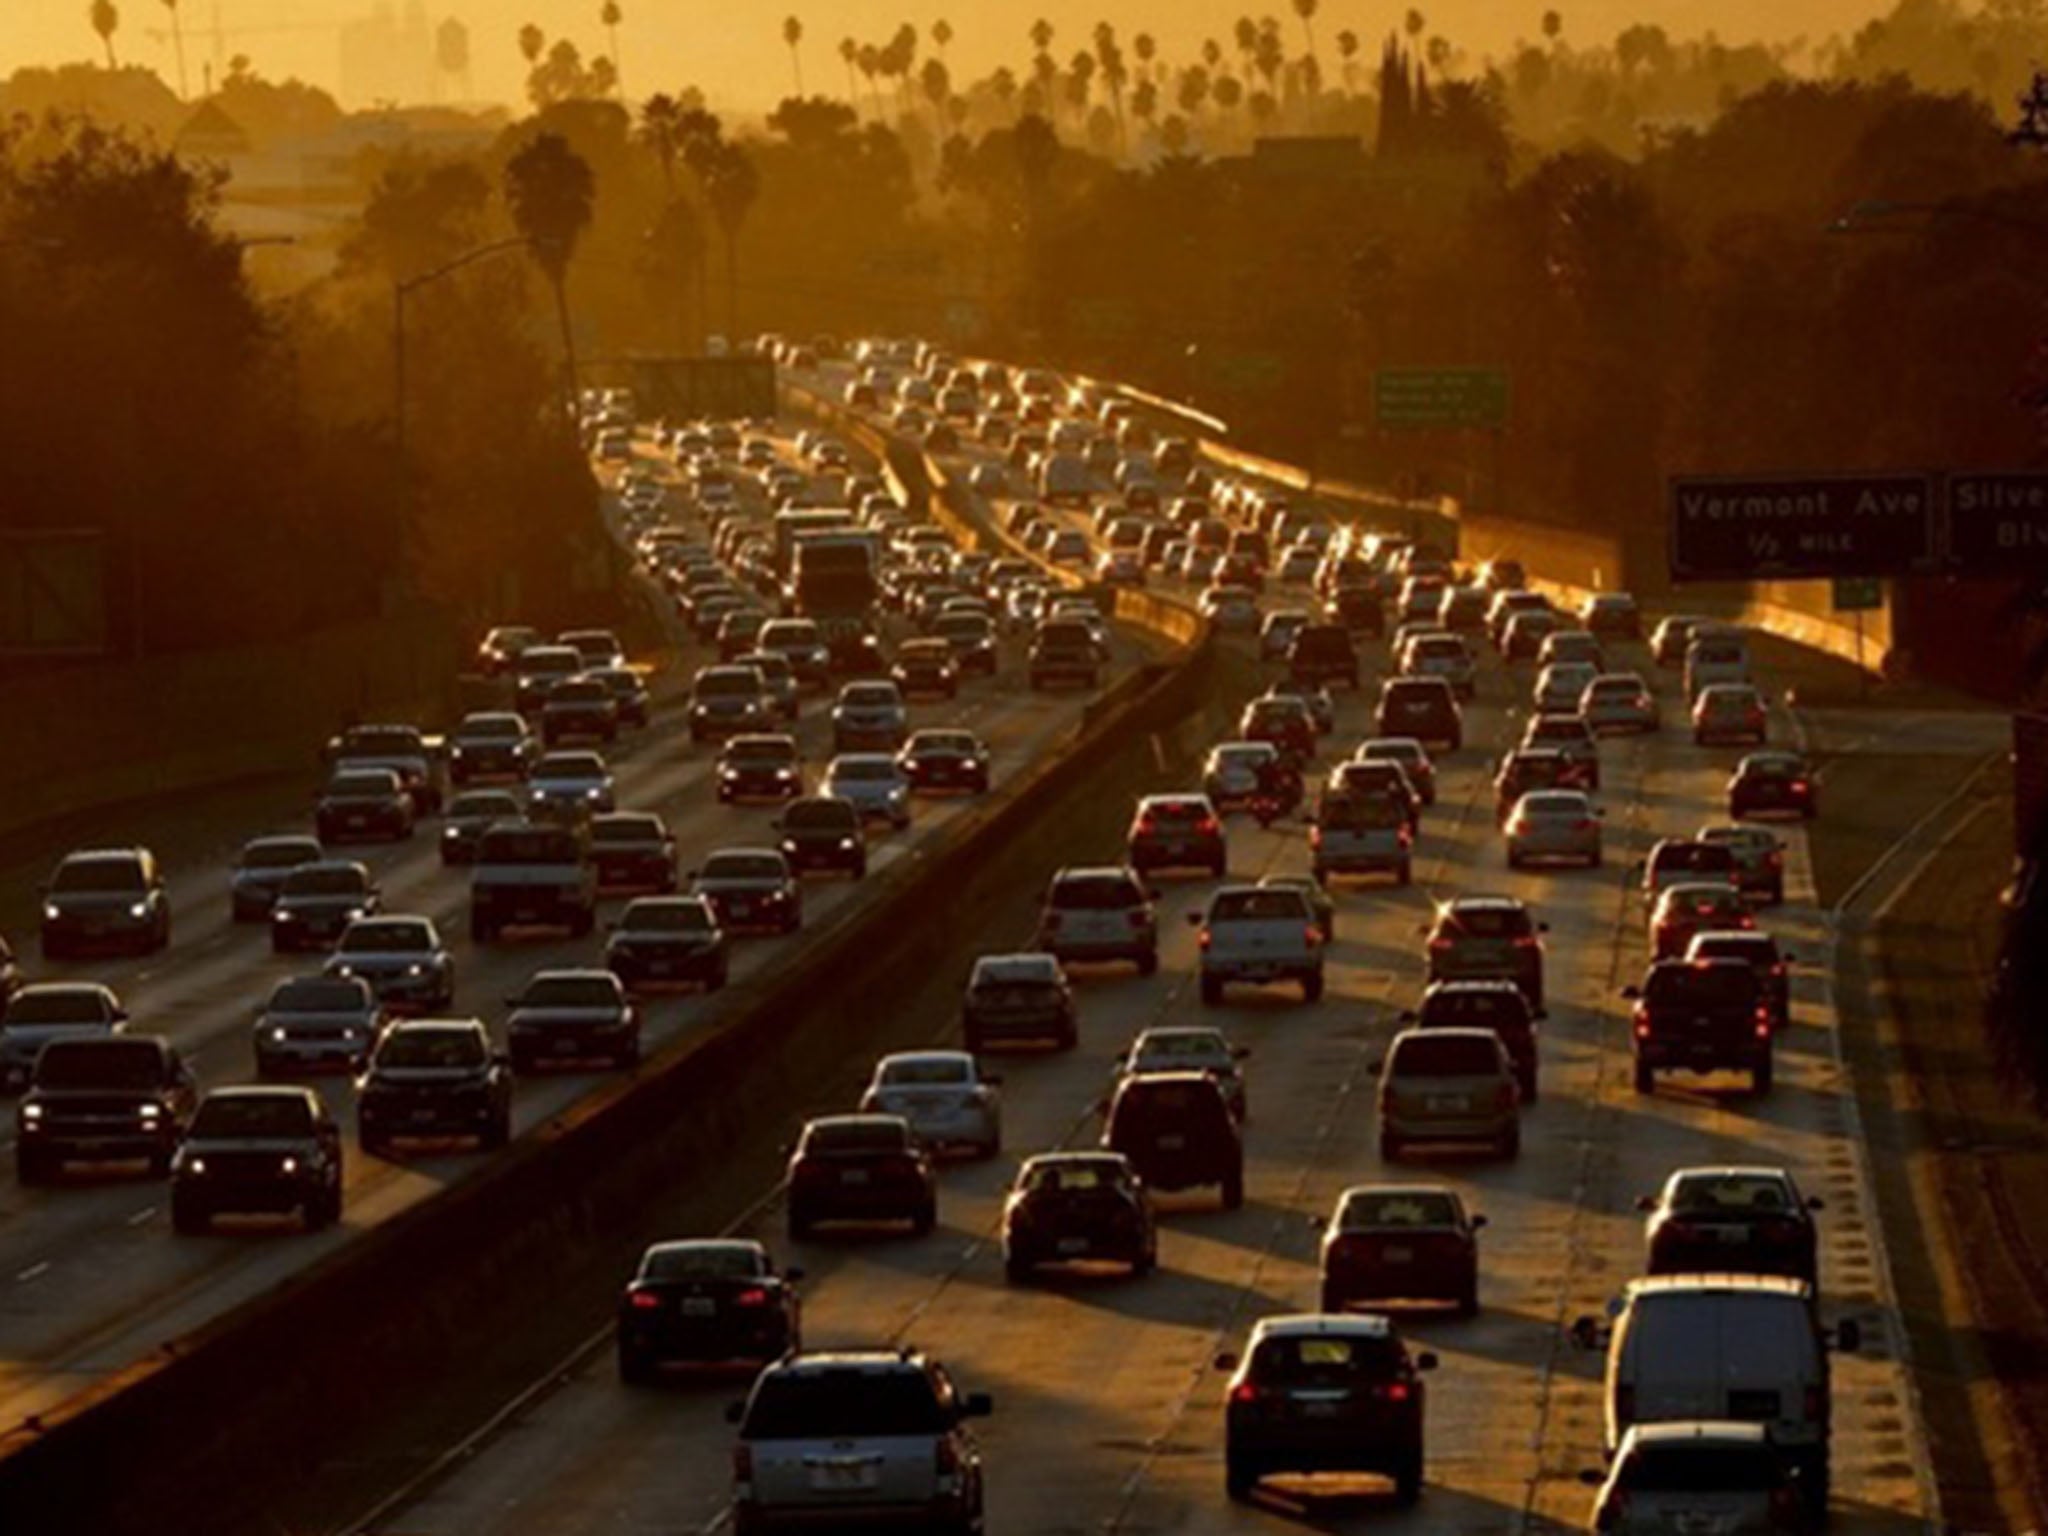
World rank compared to other large cities 10/146
Congestion Level on highways 36%
Congestion Level on non-highways 42%
Delay per day with a 30 min commute 25 min
Delay per year with a 30 min commute 95 hr
Most congested specific day Fri Feb 14, 2014
Total network length 42,217 mi
Total network length highways 1,197 mi
Total network length non-highways 41,019 mi
Total vehicle distance 15,641,975 mi
Copyright: Washington Post
Join our commenting forum
Join thought-provoking conversations, follow other Independent readers and see their replies
Comments