General Election 2015 explained: Opinion polls
Continuing our daily miscellany celebrating the facts, figures and folklore of British general elections

Your support helps us to tell the story
From reproductive rights to climate change to Big Tech, The Independent is on the ground when the story is developing. Whether it's investigating the financials of Elon Musk's pro-Trump PAC or producing our latest documentary, 'The A Word', which shines a light on the American women fighting for reproductive rights, we know how important it is to parse out the facts from the messaging.
At such a critical moment in US history, we need reporters on the ground. Your donation allows us to keep sending journalists to speak to both sides of the story.
The Independent is trusted by Americans across the entire political spectrum. And unlike many other quality news outlets, we choose not to lock Americans out of our reporting and analysis with paywalls. We believe quality journalism should be available to everyone, paid for by those who can afford it.
Your support makes all the difference.Accuracy
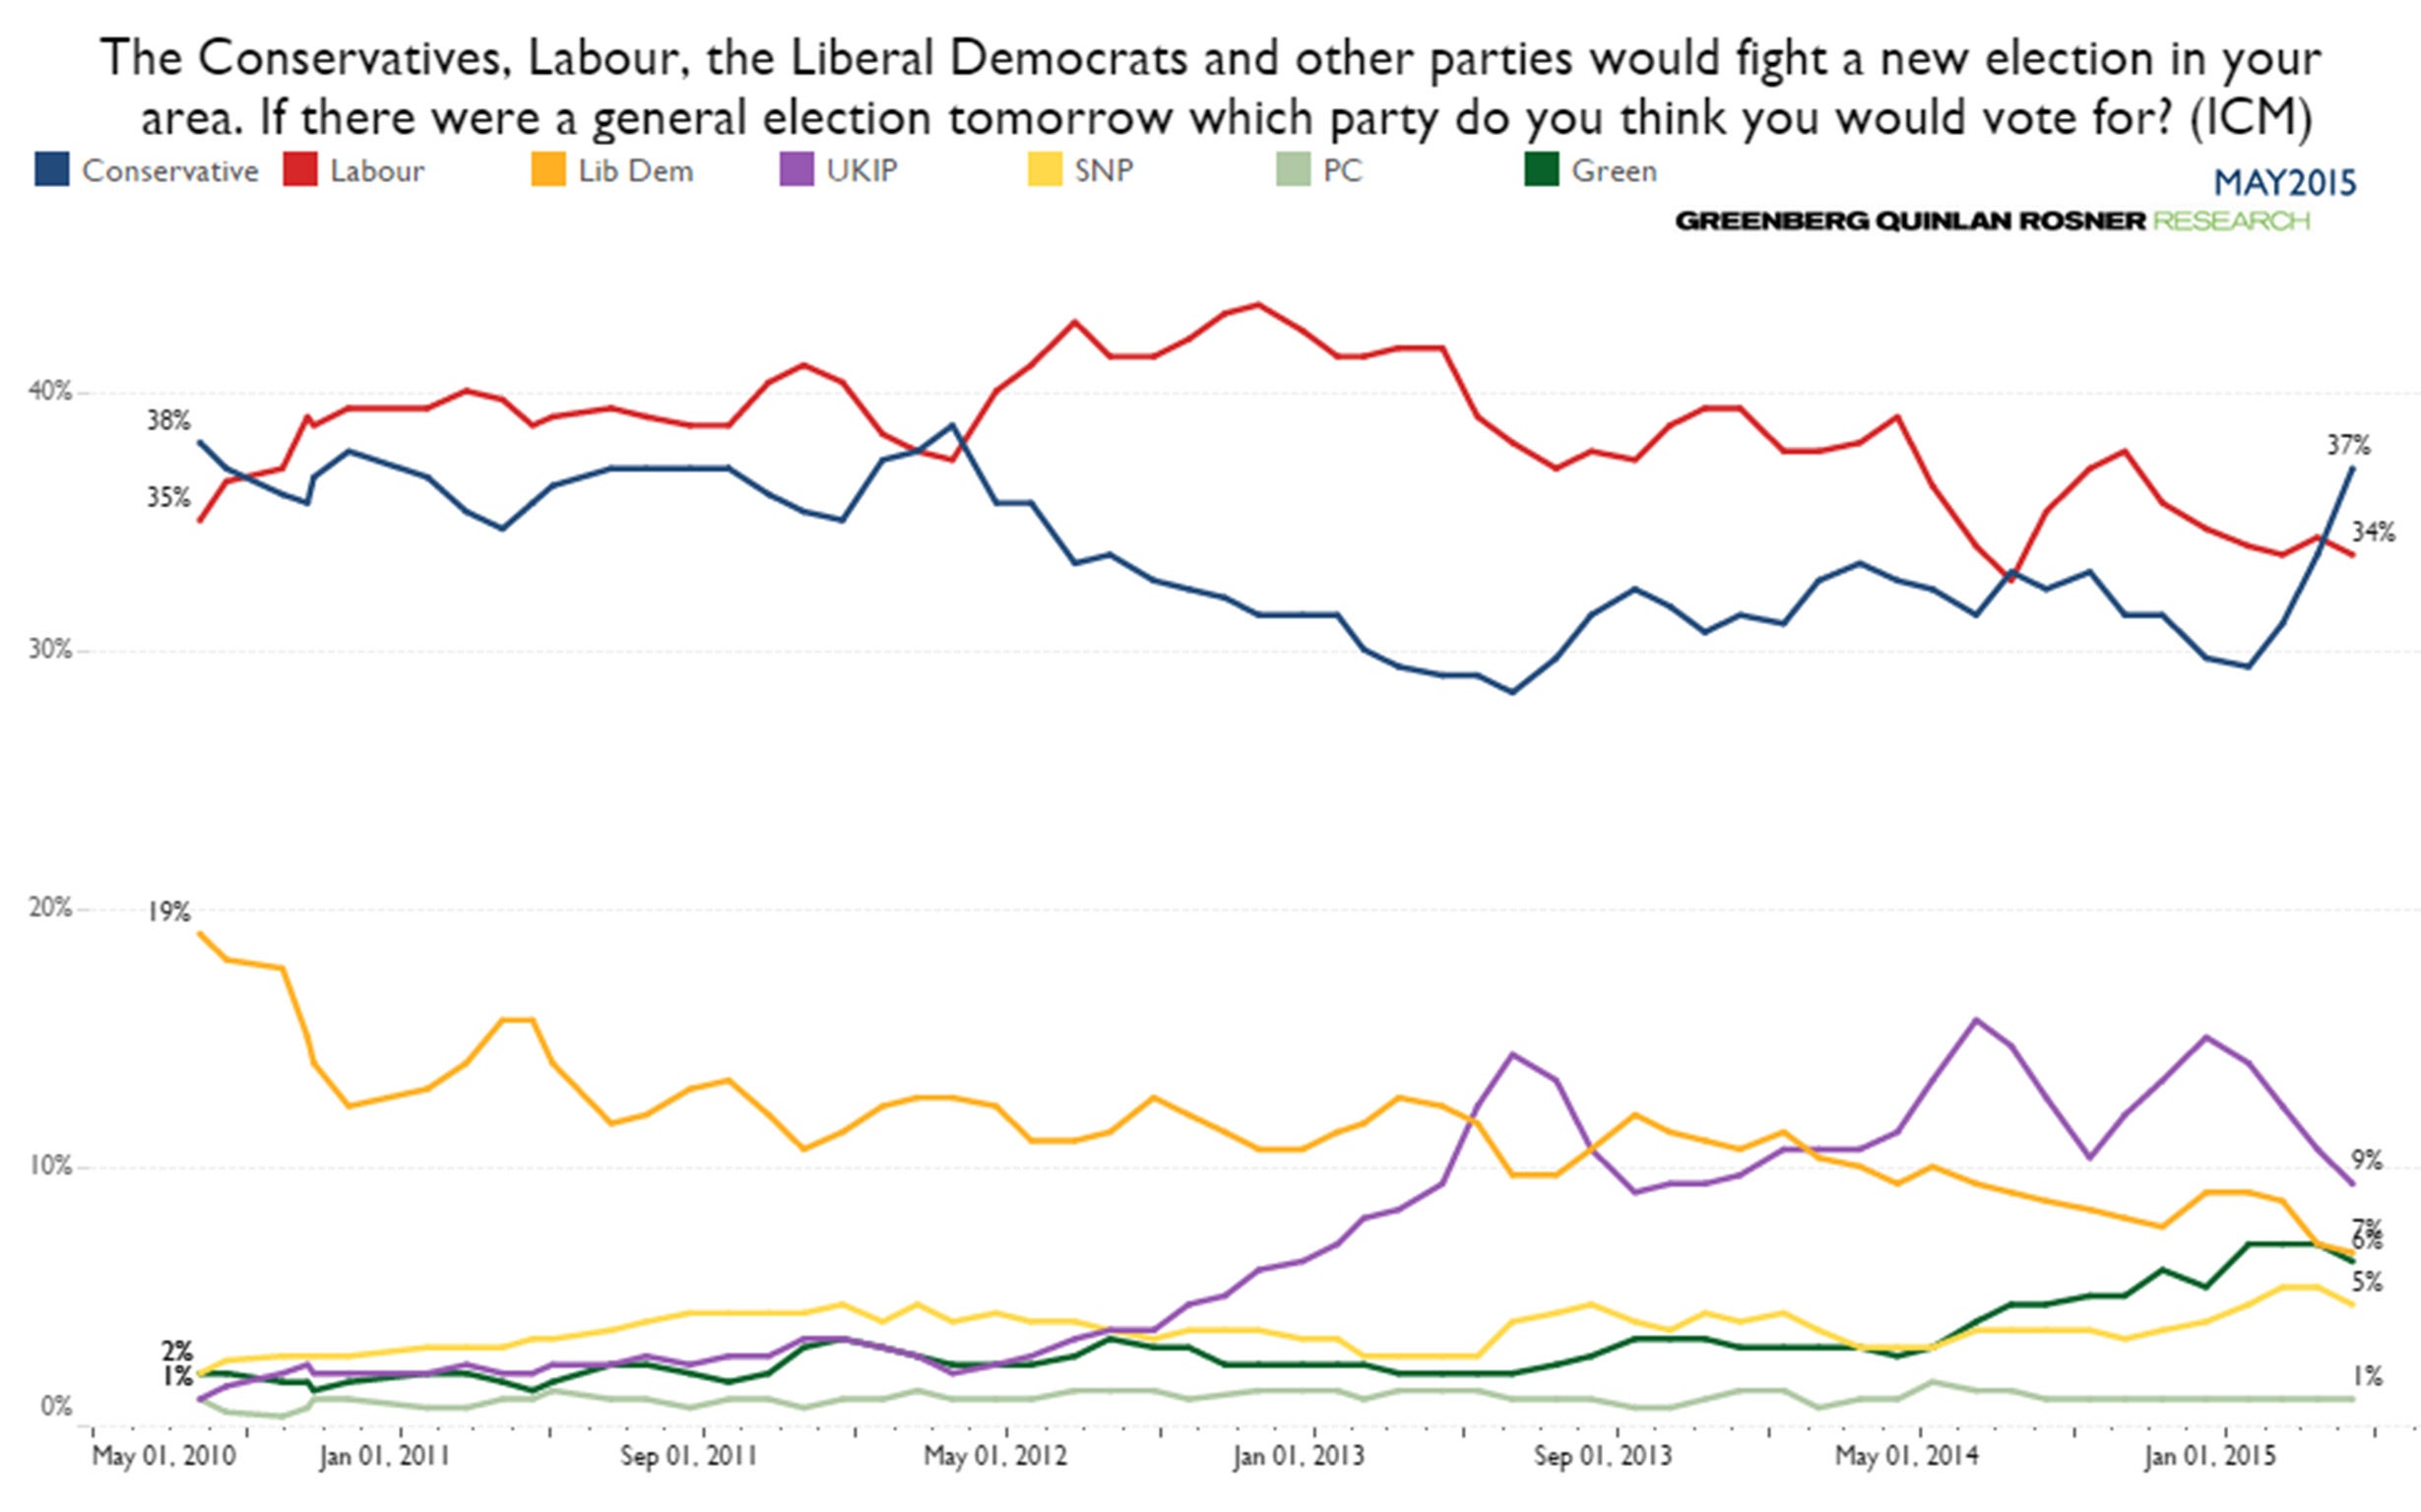
Polling companies usually expect a margin of error of about 3 per cent from a genuinely random and representative sample of 1,000 people. For a sample of 2,000, the expected margin of error would be 2 per cent.
For the 2010 general election, most polling companies’ final polls underestimated support for Labour and the Conservatives, and all nine of the main companies that conducted polls in the final four days before the election overestimated support for the Liberal Democrats.
None the less, the British Polling Council (BPC) considered that the pollsters’ final estimates correctly foretold “the main story of the 2010 election”.
Are you undecided about who to vote for on 7 May? Are you confused about what the parties stand for and what they are offering? Take this interactive quiz to help you decide who to vote for...
According to the British Polling Council, the most successful general election from its members’ point of view was that of 2005. No final estimate of that result was more than 1.5 per cent adrift, and each individual estimate was within 2 per cent of the result for each party.
However, figures in the authoritative British Electoral Facts 1832-2012, by Colin Rallings and Michael Thrasher (which does not confine itself to BPC members), suggest that – as far as the winning party and the winning party’s lead were concerned – there was an average error of 2.1 per cent in 2005, compared with just 1 per cent in 2010.
In Rallings and Thrasher’s book, the pollsters’ performance was most impressive in 1964, when Gallup and NOP (then the only such companies operating) achieved an average margin of error of 0.7 per cent.
The least successful general election for pollsters was that of 1992, when the five main companies were out by an average of 8.7 per cent.
History
Earliest known political opinion poll: 1824 (by the Harrisburg Examiner in the US presidential contest).
Earliest known scientific political opinion poll: 1936 (by George Gallup, also in a US presidential contest).
First British political opinion poll: 1937 (by the British Institute of Public Opinion, a Gallup subsidiary).
Balance
Because of the gender imbalance in the general population, a woman who takes part in an opinion poll is counted as 1.133 people. A man counts as 0.891 people.
Restrictions
BBC guidelines forbid the commissioning of opinion polls during the election period. Other forms of quantifying support for parties are also restricted – for example, online surveys and text votes.
Push polls
Respectable polling companies have expressed concern about the increasing use of “push” polls – purported telephone surveys whose real purpose is to spread damaging claims about political opponents in the form of questions.
Exit polls
The BBC, ITV and Sky are jointly commissioning an exit poll for next week’s election. It will be published when the polls close at 10pm.
The first exit poll results published by those organisations for the 2010 general election (later revised) suggested that the Conservatives would win 307 seats, Labour 255, the Liberal Democrats 59 and other parties 29. The actual results were, respectively, 306, 258, 57 and 29.
Exit polls have not always been so reliable. In 1992, they wrongly predicted a hung parliament, while at one point on election night in 1974 calculations based on poll results suggested a Labour majority of 144 seats. (Actual majority: three.)
Roughly one voter in 2,260 will be invited to take part in an exit poll. Of these, roughly 15 per cent will refuse – as every voter is entitled to do.
It is illegal to publish the results of an exit poll before polling has finished.
On Thursday: No.17 Parties
Subscribe to Independent Premium to bookmark this article
Want to bookmark your favourite articles and stories to read or reference later? Start your Independent Premium subscription today.
Join our commenting forum
Join thought-provoking conversations, follow other Independent readers and see their replies
Comments