General Election 2015 explained: Turnout
Continuing our daily miscellany celebrating the facts, figures and folklore of British general elections

Your support helps us to tell the story
From reproductive rights to climate change to Big Tech, The Independent is on the ground when the story is developing. Whether it's investigating the financials of Elon Musk's pro-Trump PAC or producing our latest documentary, 'The A Word', which shines a light on the American women fighting for reproductive rights, we know how important it is to parse out the facts from the messaging.
At such a critical moment in US history, we need reporters on the ground. Your donation allows us to keep sending journalists to speak to both sides of the story.
The Independent is trusted by Americans across the entire political spectrum. And unlike many other quality news outlets, we choose not to lock Americans out of our reporting and analysis with paywalls. We believe quality journalism should be available to everyone, paid for by those who can afford it.
Your support makes all the difference.Trends
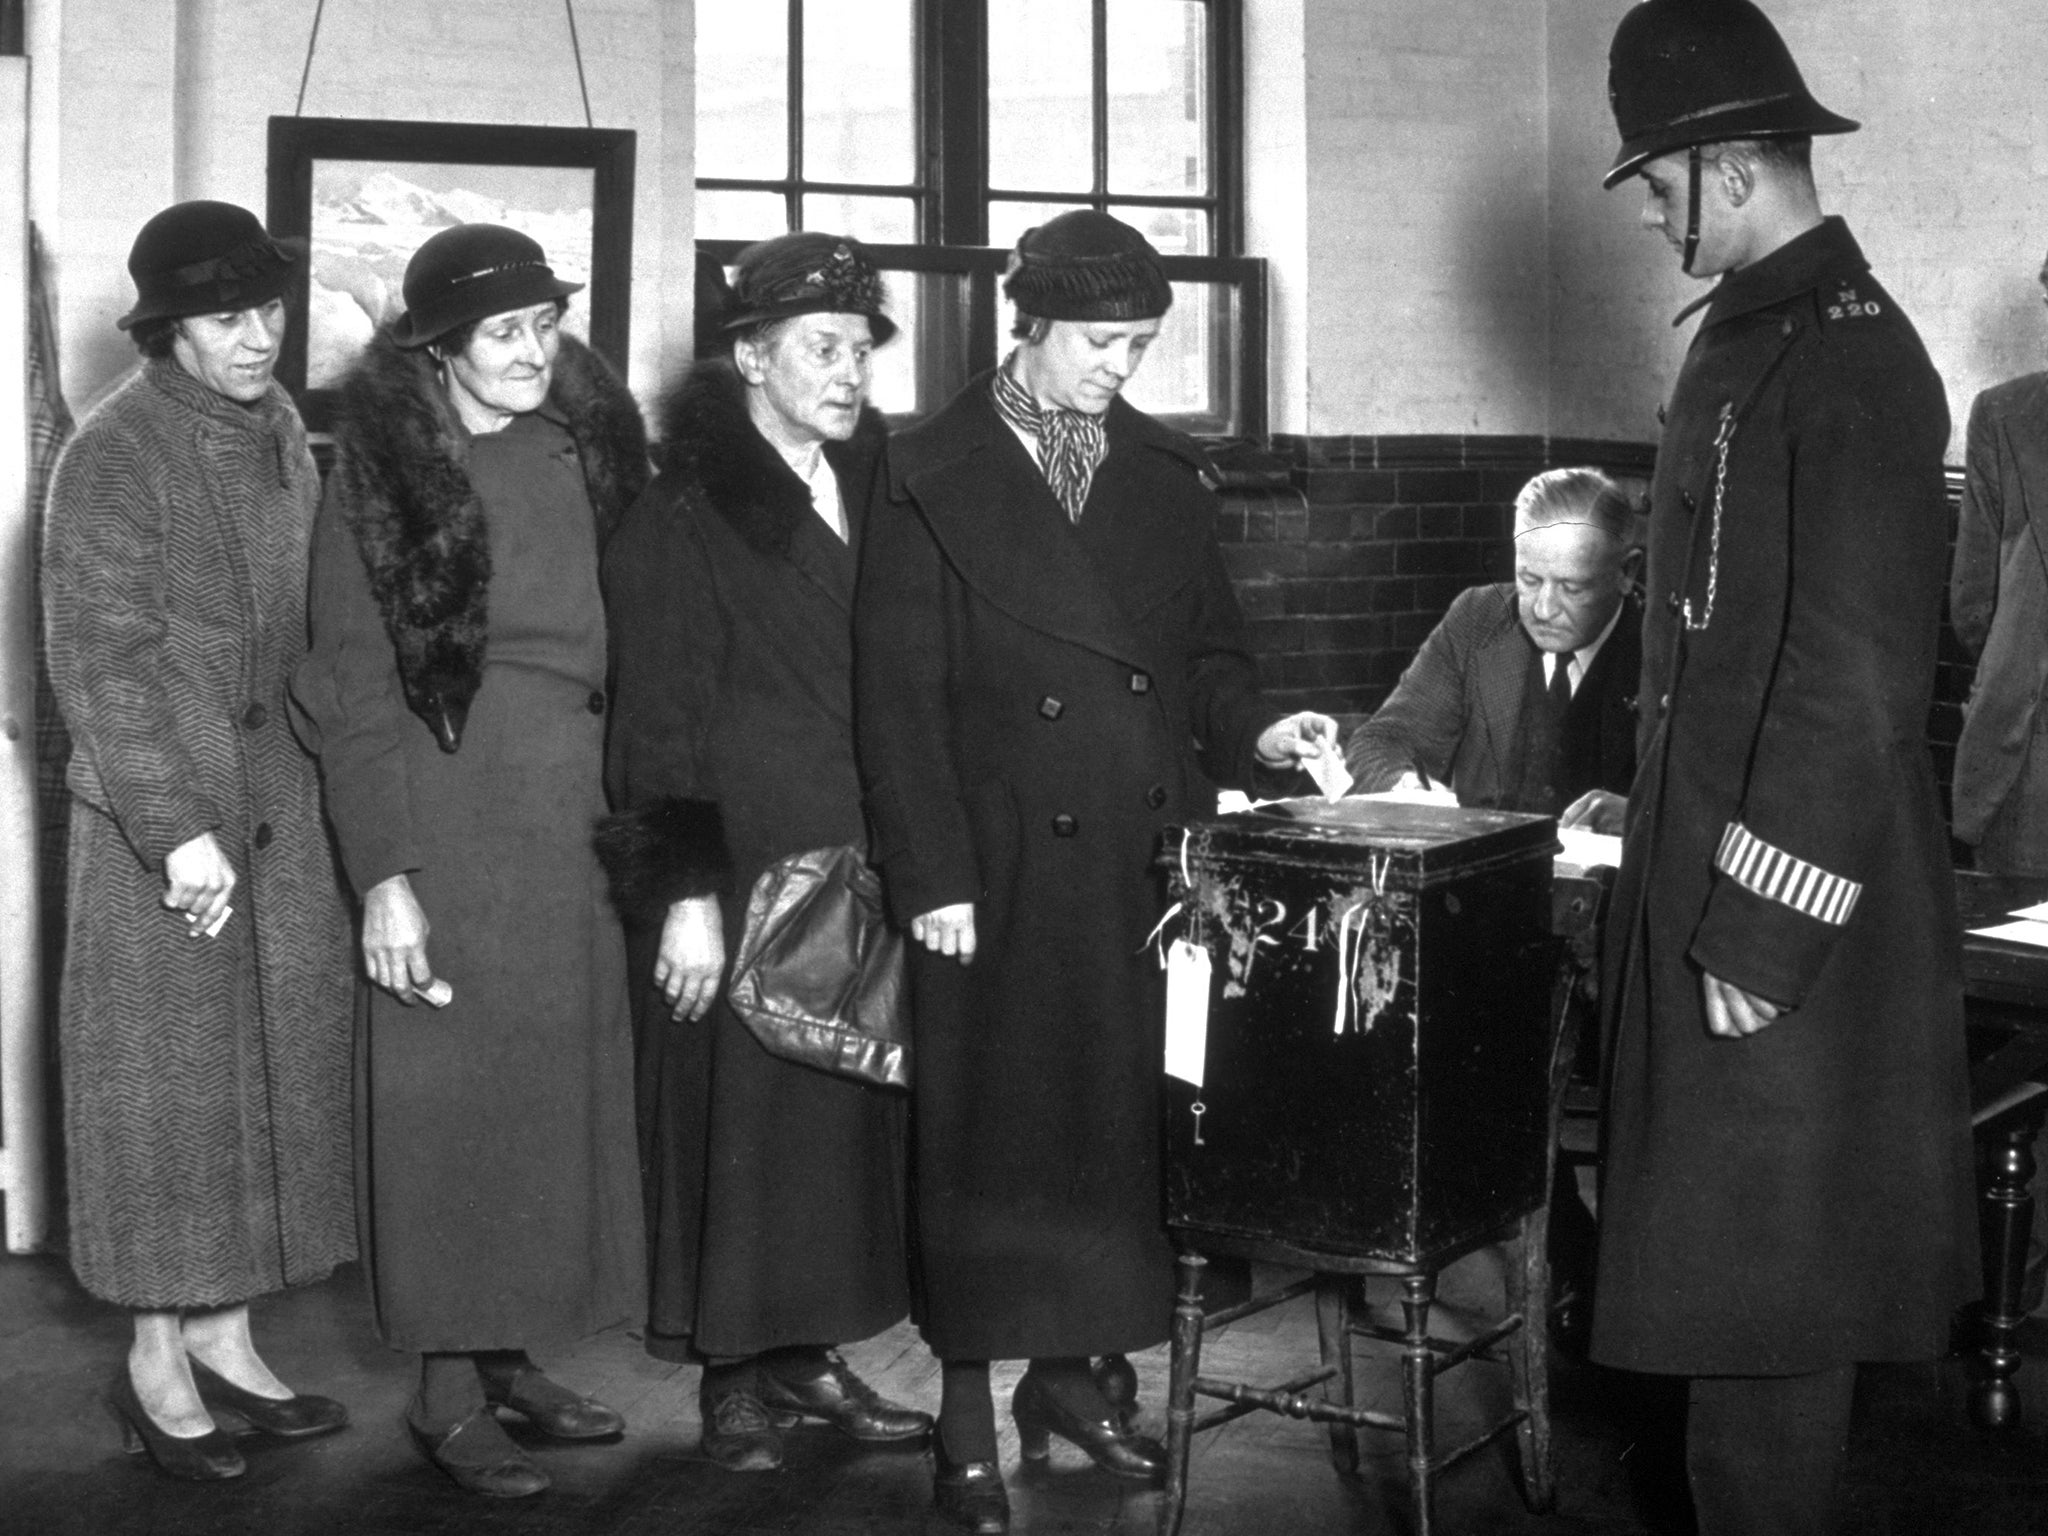
Voter turnout in the UK is in long-term decline but has increased in recent elections. In 1918, turn-out was artificially low (57.2 per cent) because of the First World War. Thereafter, it fluctuated through the 20th century but never fell below 70 per cent.
The 21st century has been a different matter. In 2001, just 59.4 per cent of the electorate voted. Turn-out recovered slightly in 2005 to 61.4 per cent – and then in 2010 65.1 per cent of the electorate voted.
Are you undecided about who to vote for on 7 May? Are you confused about what the parties stand for and what they are offering? Take this interactive quiz to help you decide who to vote for...
Turn-out for last year’s European Parliament elections was 34.19 per cent in the UK, compared with an EU-wide average of 43.09 per cent.
Anomalies
In the 2010 general election, the proportion of the total electorate that voted for the winning party (36.1 per cent) was only fractionally higher than the proportion that did not vote (34.9 per cent).
In the 2005 general election, the non-voters (39 per cent) outnumbered those who voted for the winning party (21 per cent of all those who could have voted).

Local variations
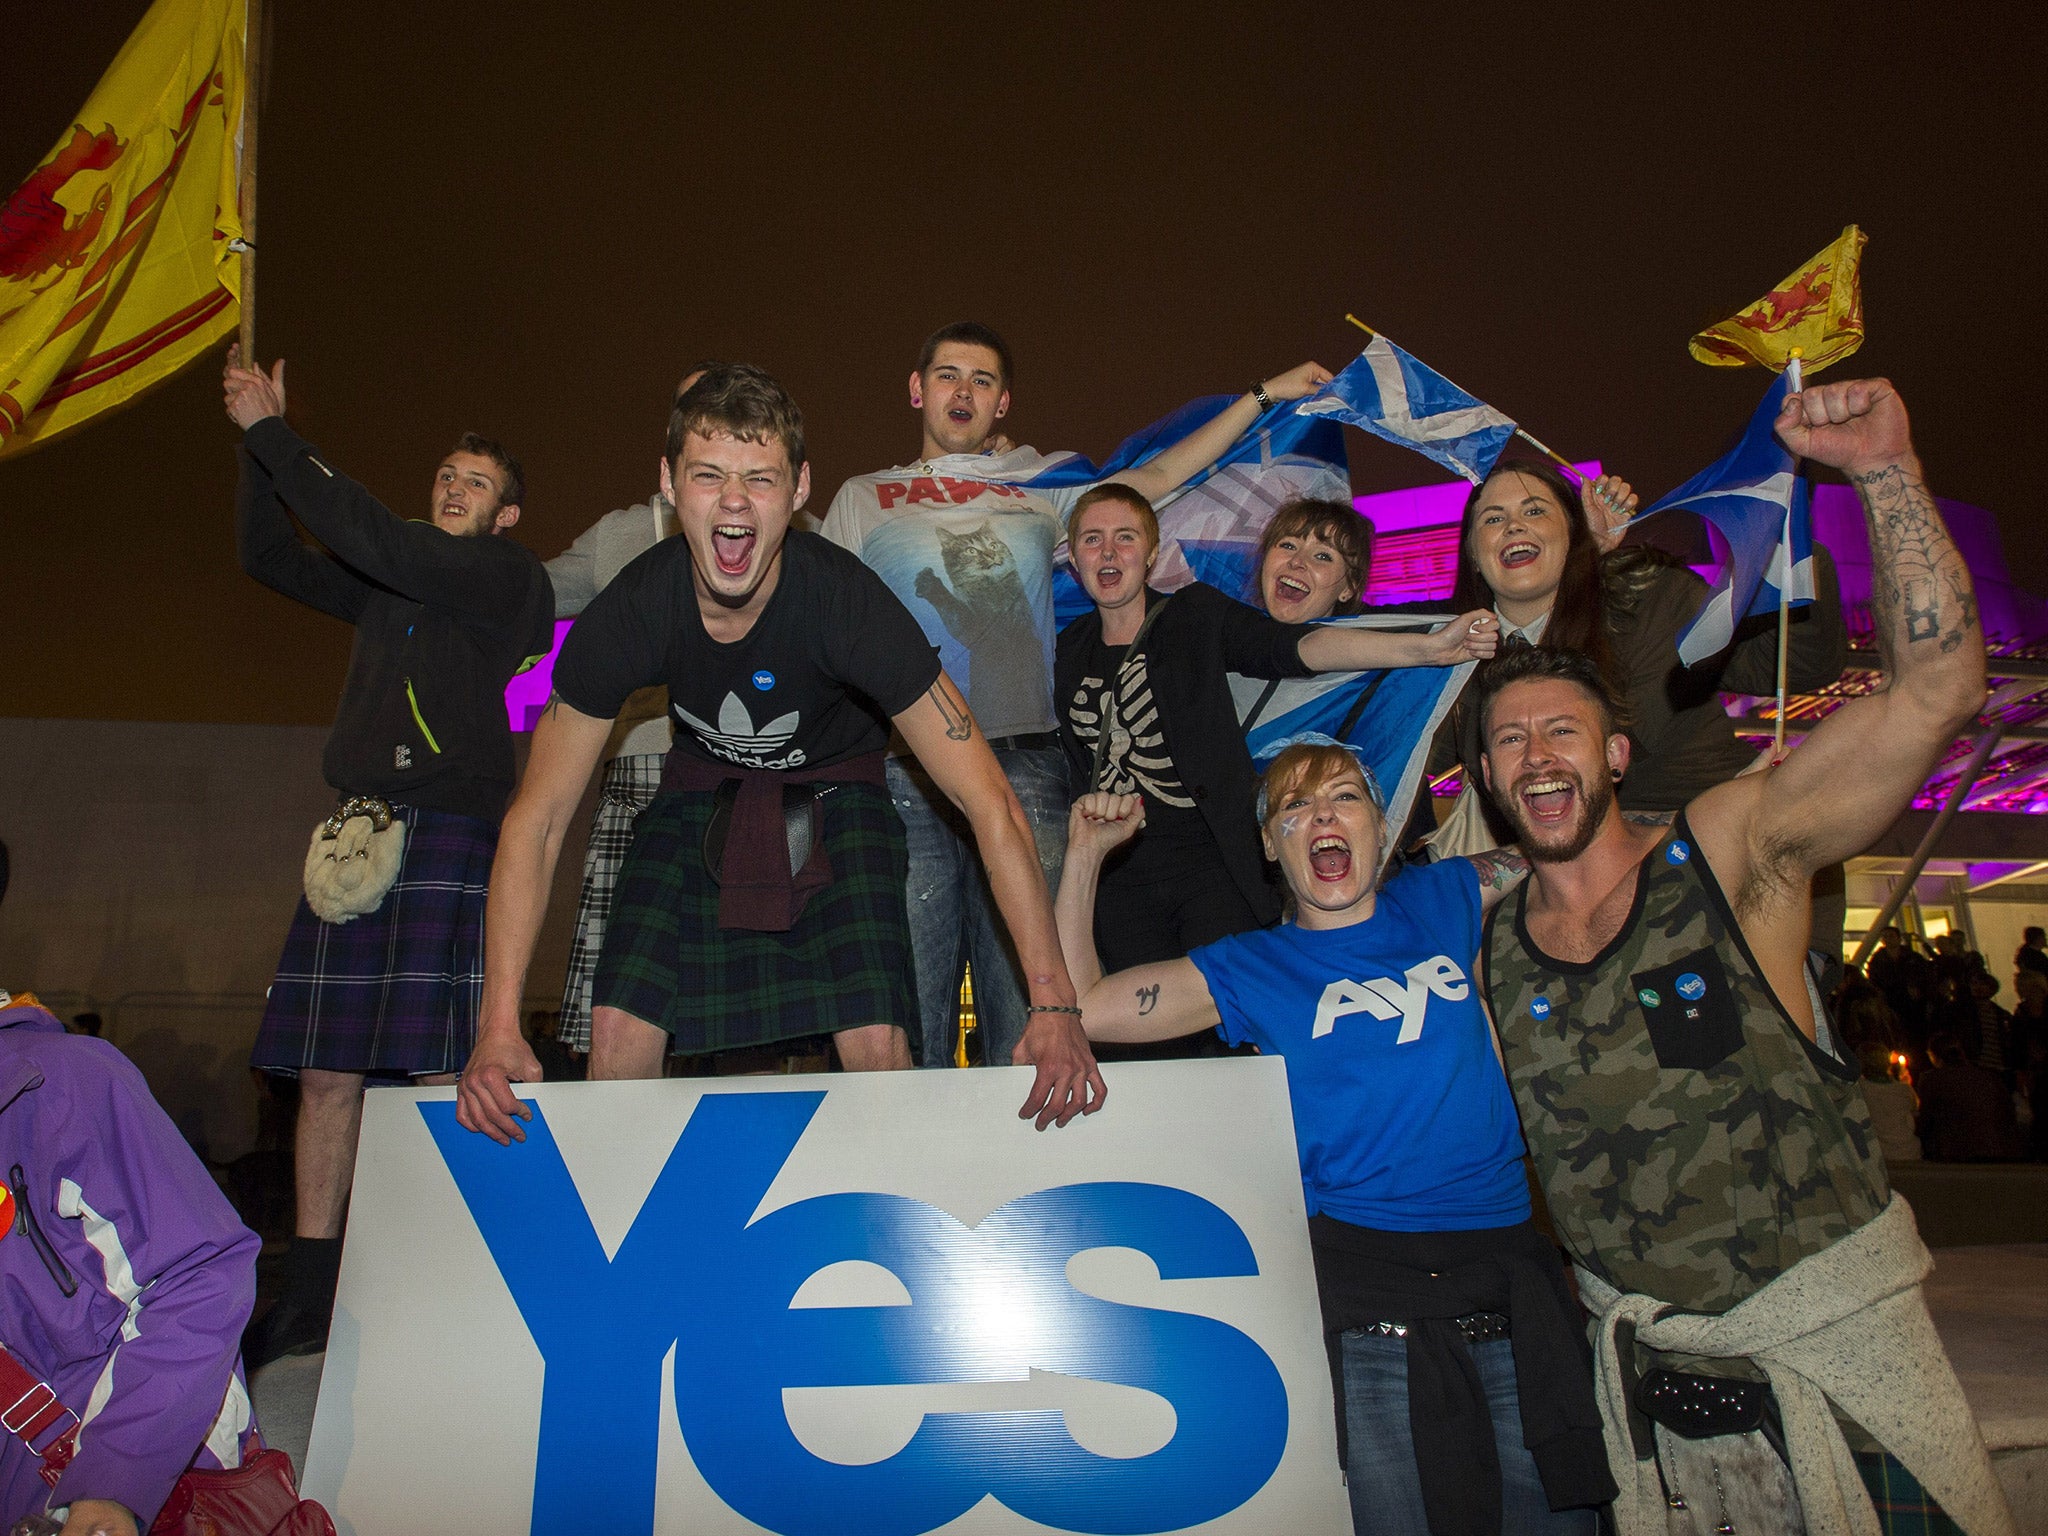
Voters in Scotland are significantly more likely to say that they are certain to vote: 72 per cent, compared with a national average of 49 per cent..
The constituency with the highest turn-out in the 2010 general election was East Renfrewshire, with 73 per ceNT.
At the other end of the scale, a mere 44.3 per cent of the Manchester Central electorate bothered to vote in 2010.
Projections
The Hansard Society’s most recent Audit of Political Engagement, published in March, suggested that just 49 per cent of the electorate are certain to vote in the 2015 general election.
In an Ipsos-Mori poll in February, seven per cent of adults said they were certain not to vote.
Age
There is a correlation between age and likelihood of voting. Only 50 per cent of men aged 18-to-24, and 39 per cent of women, voted in 2010’s general election. Among those aged 55 and over, 76 per cent of men and 73 per cent of women voted.
Only 16 per cent of 18-to-24-year-olds are certain to vote in an election, while 30 per cent in this age category told the Hansard Society that they are certain not to vote.
Voters aged over 75 are more than four times as likely to be “absolutely certain to vote” than voters aged 18-to-24
In a ComRes survey in February, only 60 per cent of 18-to-24-year-olds said they cared who won the coming general election.
Party allegiance
According to the Hansard Society, just 76 per cent of people who say they are strong supporters of a party also say they are certain to vote.
Those who identify themselves as supporters of the Conservative Party are nearly 50 per cent more likely to say that they are certain to vote than those who say that they support Labour.

Gender
Women have become less likely to vote over the years. In the 1992 general election, more women voted than men (78.2 per cent to 77.2 per cent). In 2010, however, just 64 per cent of women voted, compared with 67 per cent of men.
Men are more likely than women to describe themselves as interested in politics. In the Hansard Society’s most recent Audit of Political Engagement, 55 per cent of men said that they were interested, compared with 43 per cent of women. Men are also (predictably) more likely to claim to be knowledgeable about politics.
Race
Whereas 52 per cent of white voters consider themselves absolutely certain to vote, the equivalent figure for black and ethnic minorities is 33 per cent.
Join our commenting forum
Join thought-provoking conversations, follow other Independent readers and see their replies
Comments