Mapped: How much rents have gone up in your region as prices hit record high
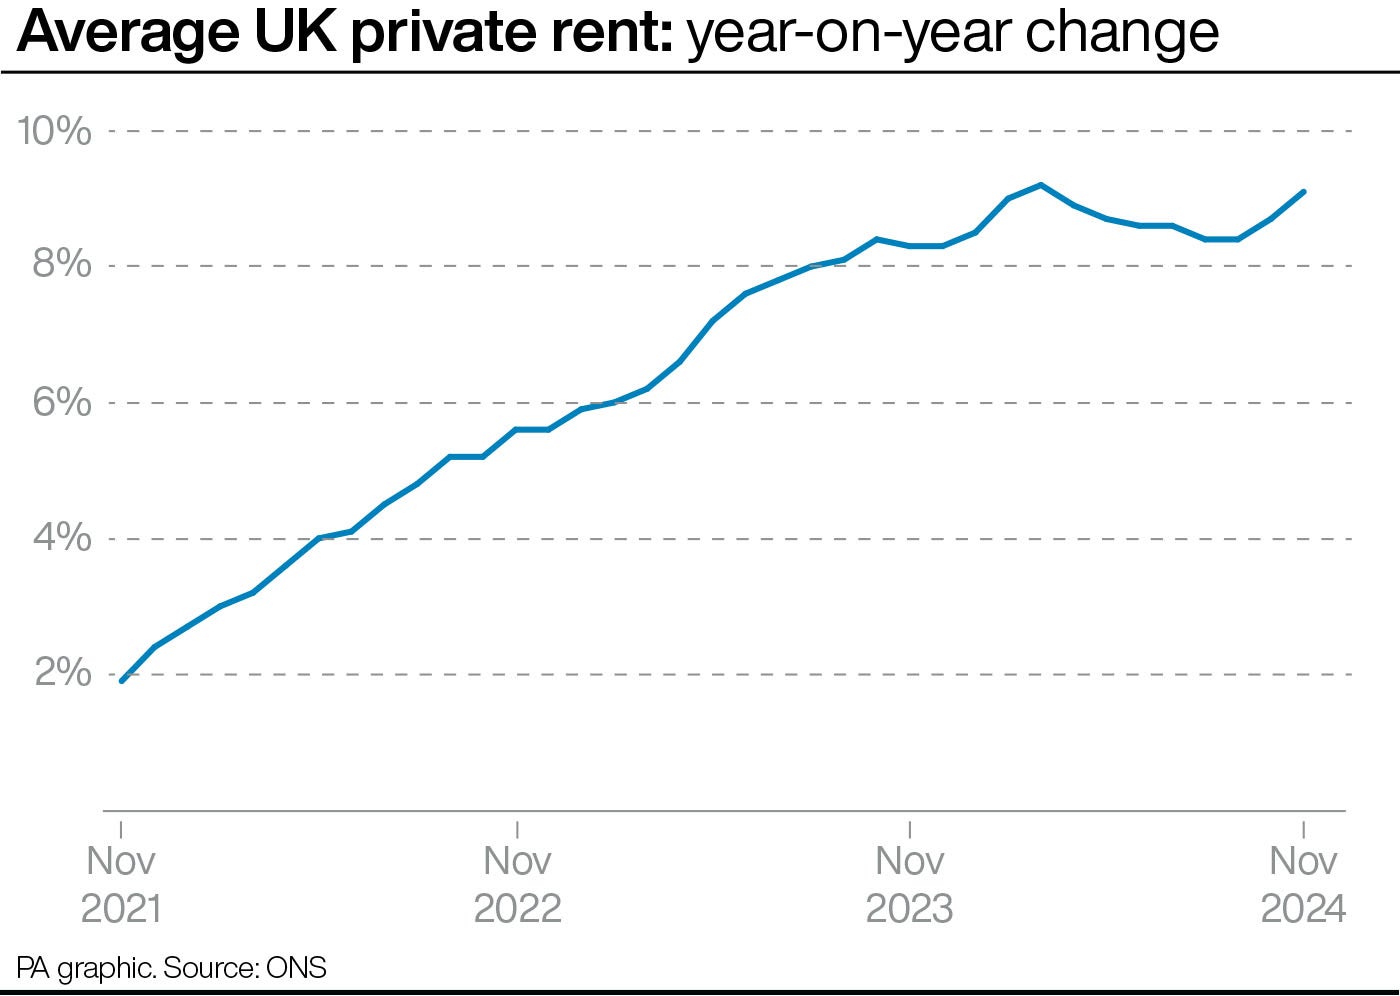
Office of National Statistics figures show annual growth in private rental prices accelerated to 9.1 per cent in November, from 8.7 per cent in October

Your support helps us to tell the story
From reproductive rights to climate change to Big Tech, The Independent is on the ground when the story is developing. Whether it's investigating the financials of Elon Musk's pro-Trump PAC or producing our latest documentary, 'The A Word', which shines a light on the American women fighting for reproductive rights, we know how important it is to parse out the facts from the messaging.
At such a critical moment in US history, we need reporters on the ground. Your donation allows us to keep sending journalists to speak to both sides of the story.
The Independent is trusted by Americans across the entire political spectrum. And unlike many other quality news outlets, we choose not to lock Americans out of our reporting and analysis with paywalls. We believe quality journalism should be available to everyone, paid for by those who can afford it.
Your support makes all the difference.Annual growth in UK house prices and rents has accelerated, with rental price inflation in England and London hitting record highs, according to official figures.
The average house price increased by 3.4 per cent to £292,000 in the 12 months to October, ticking upwards from 2.8 per cent in September, according to Office for National Statistics (ONS) data.
In October, average prices increased in England to £309,000 (3.0 per cent annual growth), in Wales to £222,000 (4.0 per cent), and in Scotland to £197,000 (5.5 per cent).
In the English regions, the north-east had the highest rate of house-price growth in the 12 months to October, at 4.7 per cent, and London had the weakest, at 0.2 per cent.
The report also showed annual growth in private rental prices rose to 9.1 per cent across the UK in November, from 8.7 per cent in the 12 months to October.
The Independent has put together this map below to show the average rent prices in English regions.
Within England, rental price inflation was highest in London (11.6 per cent) and lowest in Yorkshire and the Humber (5.7 per cent) in the 12 months to November.
The ONS report said the annual rise in London rents was higher than in the 12 months to October 2024 (10.4 per cent), “and reflects a new record high annual growth for London.”
“The rise in London’s annual inflation was caused by two consecutive months of large rent rises, compared with smaller rises a year ago,” the report said.
The average private rent in Britain was £1,319 per month in November – £110 higher than in November 2023.
“Average rent increases continue to be highest in London while annual rent inflation reached a record high for England,” ONS head of housing market indices Aimee North said

In England, the average was £1,362 in November, up 9.3 per cent (£116) from a year earlier.
The figures were released as the ONS said Consumer Prices Index (CPI) inflation rose to 2.6 per cent in November, from 2.3 per cent the previous month.
This is the highest rate since March and the second rise in two months.
Additional reporting by PA.
Join our commenting forum
Join thought-provoking conversations, follow other Independent readers and see their replies
Comments