London has among lowest rates of booster jabs in England
Around 2.5 million Londoners are still yet to have their first dose of the coronavirus vaccine
Covid-19 vaccine rates in London remain among the lowest in the country, new data has revealed, at almost 10 per cent below the national average in certain age groups.
According to most recent data from NHS England, the capital lags behind other areas in all but two age categories, 18-24 — with 74.2 per cent of those people having had their first dose — and 25-29, with 81.4 per cent having had the initial jab.
Some 2.5 million Londoners are still yet to have their first dose of the coronavirus vaccine.
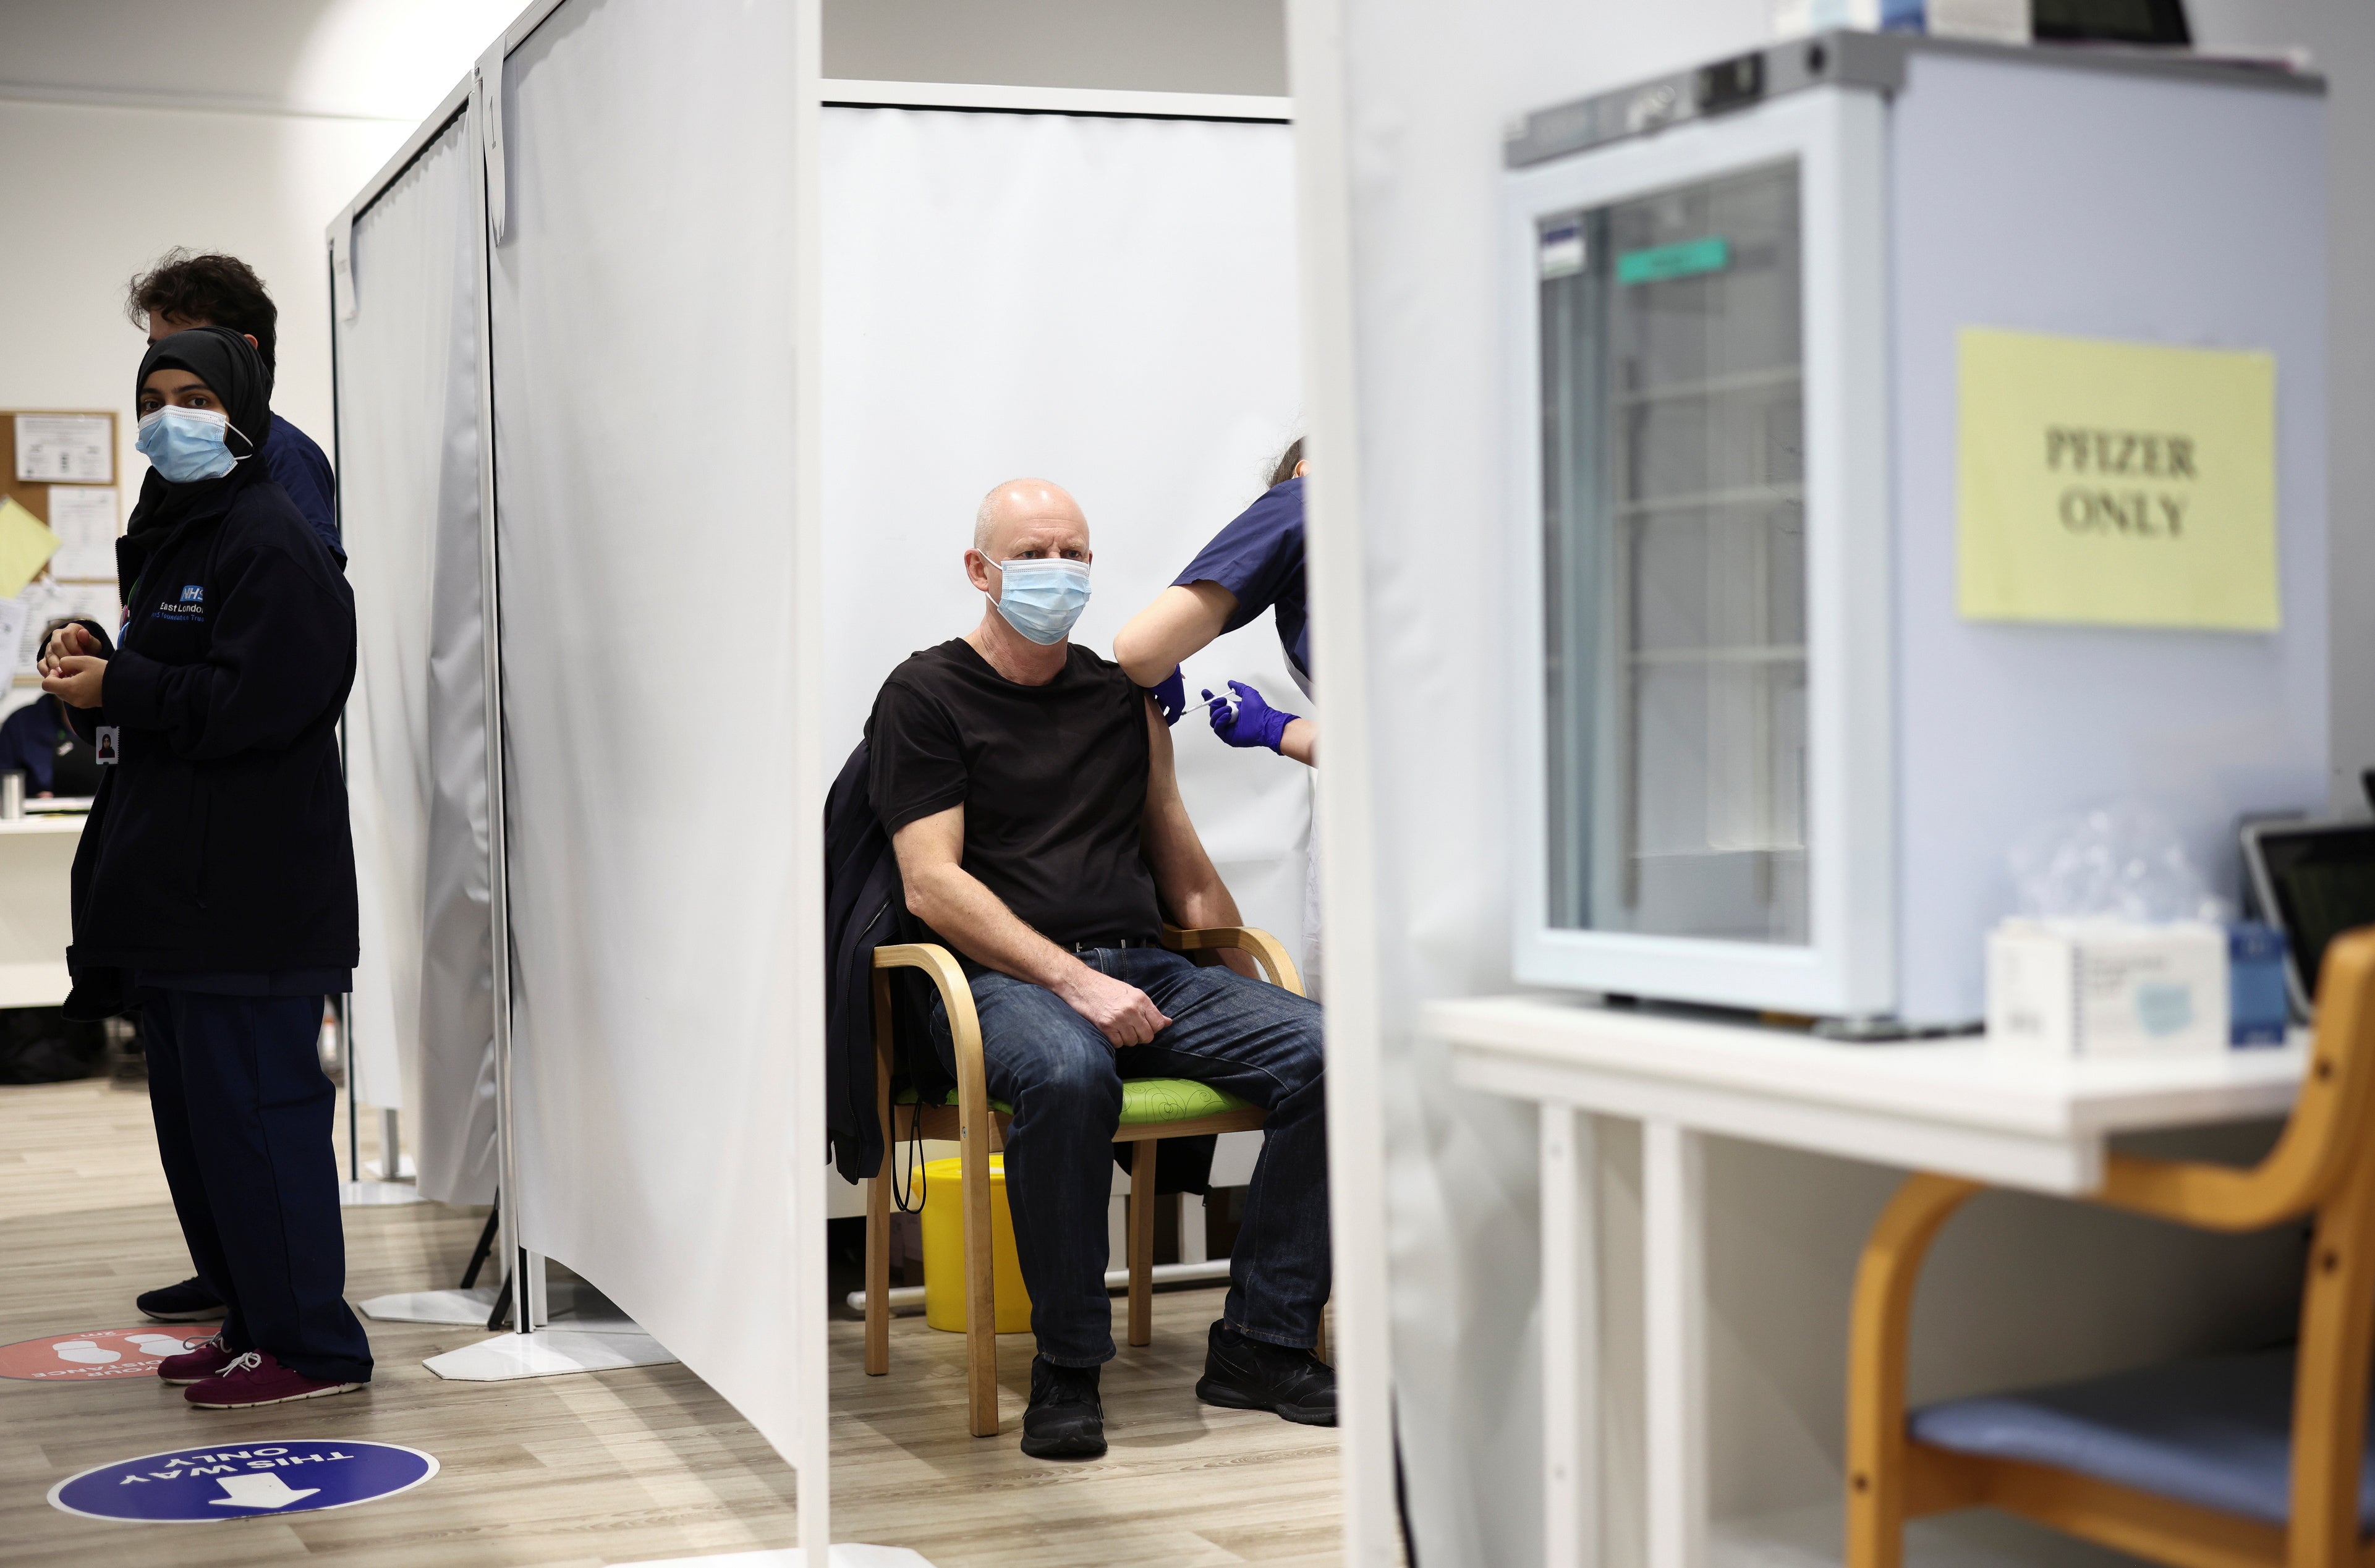
It comes after the NHS announced that over 400 vaccination hubs will be opened this weekend in a bid to speed up booster jabs to fight the new omicron variant.
The lowest take-up is in Tower Hamlets, east London, where only 34.6 per cent of over-50s are estimated to have had either a booster or third dose.
After Stratford-upon-Avon (76.3 per cent) and Hart in Hampshire (75.4 per cent), the areas with the highest take-up are Warwick (74.1 per cent), Hertsmere in Hertfordshire (73.5 per cent) and Horsham in West Sussex (73.5 per cent).
It comes as the Government has said all eligible adults in England aged 18 and over will be offered a booster dose by the end of January.
The time between a second dose and a booster is also being reduced from six months to three.
The figures were compiled by the PA news agency from NHS England data for vaccinations given up to November 28. The list shows latest estimates of the proportion of people aged 50 and over in England who have received either a booster or third dose of Covid-19 vaccine, broken down by local authority:
Stratford-on-Avon 47,797 76.3%
Hart 29,790 75.4%
Warwick 39,881 74.1%
Hertsmere 29,195 73.5%
Horsham 47,953 73.5%
Surrey Heath 26,354 71.8%
St Albans 38,264 70.9%
Scarborough 38,646 70.4%
Fylde 29,135 70.0%
Rugby 29,399 69.8%
Harrow 59,834 69.8%
Malvern Hills 28,410 69.8%
South Lakeland 38,301 69.7%
Wyre 39,376 69.5%
Lancaster 39,735 69.3%
Waverley 37,385 69.1%
East Devon 52,627 68.7%
Runnymede 21,475 68.6%
Adur 19,316 68.4%
Craven 20,148 68.2%
Harborough 28,869 68.1%
Middlesbrough 33,270 68.0%
Bassetlaw 35,585 67.9%
Three Rivers 24,406 67.7%
Tandridge 25,205 67.6%
South Oxfordshire 40,904 67.6%
West Lancashire 33,474 67.6%
Stafford 40,804 67.5%
New Forest 62,471 67.4%
North Somerset 64,825 67.3%
Rochford 26,313 67.2%
Ribble Valley 19,639 67.0%
Derbyshire Dales 25,348 67.0%
Wychavon 41,733 66.8%
Tewkesbury 27,614 66.8%
East Cambridgeshire 24,685 66.7%
Fareham 35,406 66.7%
Telford and Wrekin 44,481 66.6%
Solihull 59,313 66.4%
Wirral 92,458 66.3%
Chichester 39,864 66.2%
Babergh 29,886 66.2%
North East Derbyshire 31,755 66.2%
Bromsgrove 29,042 66.2%
Windsor and Maidenhead 39,038 66.1%
Cheshire East 115,014 66.0%
Rushmoor 21,423 66.0%
Stroud 35,940 65.9%
South Gloucestershire 72,588 65.9%
Hambleton 30,520 65.9%
Wyre Forest 30,578 65.9%
South Staffordshire 34,994 65.9%
Mid Suffolk 32,549 65.9%
Vale of White Horse 36,303 65.8%
Elmbridge 35,450 65.7%
Gloucester 31,073 65.6%
Bury 47,427 65.5%
Uttlesford 25,063 65.5%
Ipswich 31,360 65.4%
Barrow-in-Furness 19,028 65.4%
Guildford 33,819 65.4%
Tamworth 19,599 65.3%
Maldon 20,934 65.2%
West Oxfordshire 31,132 65.0%
Coventry 68,438 65.0%
Fenland 29,127 65.0%
Carlisle 30,941 65.0%
Trafford 56,849 65.0%
Richmond upon Thames 45,807 64.9%
Sunderland 73,487 64.9%
Cheltenham 29,327 64.9%
Cotswold 28,748 64.8%
Folkestone and Hythe 34,301 64.8%
Mid Sussex 40,377 64.7%
North Hertfordshire 33,829 64.7%
Shropshire 99,625 64.7%
North Warwickshire 18,535 64.6%
East Suffolk 79,893 64.6%
Chelmsford 44,913 64.6%
Cheshire West and Chester 95,309 64.5%
Lichfield 30,794 64.5%
Kingston upon Thames 35,770 64.5%
North Kesteven 34,205 64.4%
Stockport 75,687 64.3%
King’s Lynn and West Norfolk 46,303 64.2%
West Devon 18,917 64.2%
Exeter 26,686 63.9%
Bolsover 21,815 63.9%
Canterbury 40,833 63.8%
Kirklees 104,512 63.8%
Blaby 26,508 63.8%
Woking 23,495 63.8%
Mansfield 28,203 63.6%
High Peak 26,443 63.6%
Buckinghamshire 136,439 63.6%
Sevenoaks 32,461 63.6%
Watford 18,483 63.5%
Breckland 41,399 63.4%
Spelthorne 24,565 63.4%
West Northamptonshire 96,994 63.4%
Staffordshire Moorlands 30,141 63.3%
Darlington 28,103 63.3%
Derby 55,803 63.2%
East Hampshire 36,080 63.2%
Castle Point 26,364 63.2%
Rotherham 67,244 63.2%
Leeds 161,587 63.1%
North Tyneside 54,311 63.1%
Cannock Chase 25,829 63.1%
Havant 35,864 63.0%
Somerset West and Taunton 46,606 63.0%
South Ribble 29,870 63.0%
Mole Valley 25,587 63.0%
Selby 24,643 63.0%
Thanet 39,438 62.9%
Nuneaton and Bedworth 32,225 62.9%
Winchester 32,927 62.9%
Bath and North East Somerset 45,203 62.8%
Torbay 42,255 62.8%
Basildon 42,522 62.8%
Chorley 30,466 62.7%
Epsom and Ewell 19,130 62.7%
Oadby and Wigston 14,748 62.7%
Reigate and Banstead 35,543 62.7%
Rutland 11,909 62.6%
Northumberland 97,709 62.5%
Huntingdonshire 46,167 62.5%
Merton 39,000 62.4%
Bromley 76,471 62.3%
Havering 59,005 62.3%
East Hertfordshire 37,156 62.3%
North Lincolnshire 46,476 62.3%
Doncaster 77,002 62.3%
Broadland 38,921 62.2%
South Derbyshire 26,690 62.2%
Wiltshire 135,406 62.2%
South Kesteven 40,313 62.1%
West Lindsey 28,620 62.1%
Dacorum 35,834 62.0%
Bolton 64,635 62.0%
Preston 28,918 62.0%
Hillingdon 58,443 61.9%
Bristol, City of 78,227 61.8%
Dartford 22,156 61.8%
Bedford 40,521 61.7%
Wokingham 40,032 61.7%
Wakefield 85,633 61.7%
South Cambridgeshire 39,550 61.6%
East Riding of Yorkshire 104,205 61.6%
South Somerset 49,144 61.5%
Cornwall/Isles of Scilly 166,746 61.4%
Newcastle-under-Lyme 32,192 61.4%
South Norfolk 39,382 61.4%
Blackpool 35,609 61.1%
Mendip 32,758 61.0%
West Suffolk 44,257 61.0%
Richmondshire 14,224 61.0%
Tendring 46,116 60.9%
Gosport 21,219 60.9%
Harrogate 45,823 60.8%
Melton 14,705 60.8%
Lewes 29,828 60.8%
Rushcliffe 30,486 60.8%
West Berkshire 39,509 60.7%
York 46,074 60.7%
Mid Devon 23,054 60.7%
Tameside 52,017 60.6%
Barnet 76,828 60.6%
Enfield 63,463 60.6%
Sefton 76,146 60.6%
Eastbourne 28,360 60.5%
Central Bedfordshire 67,322 60.5%
Teignbridge 40,404 60.5%
Southend-on-Sea 43,159 60.5%
Oxford 24,443 60.4%
Cherwell 35,451 60.4%
Colchester 41,391 60.4%
Allerdale 28,236 60.3%
Wandsworth 46,783 60.2%
Chesterfield 27,169 60.2%
County Durham 134,634 60.1%
Stoke-on-Trent 54,990 60.1%
Dover 32,542 60.1%
Worcester 21,941 60.1%
South Tyneside 38,225 60.1%
Amber Valley 34,472 60.0%
Broxtowe 28,241 59.9%
North Norfolk 35,504 59.8%
Eden 16,699 59.8%
Sheffield 116,156 59.7%
Brentwood 18,847 59.6%
Erewash 28,768 59.5%
Milton Keynes 51,710 59.3%
Walsall 60,678 59.3%
Maidstone 40,051 59.2%
Newcastle upon Tyne 54,414 59.2%
East Lindsey 45,211 59.1%
Bournemouth, Christchurch and Poole 96,285 59.1%
Broxbourne 21,587 59.1%
Crawley 21,145 59.1%
Dudley 76,366 59.0%
Sutton 41,526 58.9%
Kingston upon Hull, City of 50,479 58.8%
Test Valley 32,199 58.7%
St. Helens 43,552 58.7%
Rother 30,924 58.5%
East Staffordshire 28,199 58.5%
Epping Forest 31,157 58.5%
Gravesham 22,973 58.5%
Ashford 30,620 58.5%
Gedling 28,928 58.5%
Eastleigh 31,300 58.4%
Hounslow 46,559 58.3%
Newark and Sherwood 31,658 58.3%
Braintree 36,783 58.1%
Salford 46,334 58.1%
Peterborough 37,922 58.1%
Ashfield 29,699 57.8%
Arun 46,544 57.8%
Isle of Wight 42,181 57.8%
Stockton-on-Tees 44,483 57.6%
Welwyn Hatfield 22,968 57.4%
Rossendale 16,417 57.4%
Reading 26,606 57.3%
Wealden 45,509 57.3%
Tonbridge and Malling 29,887 57.3%
Copeland 18,061 57.3%
Swindon 46,634 57.2%
Calderdale 48,345 57.0%
Dorset 112,315 57.0%
Sedgemoor 32,348 56.9%
Bexley 50,163 56.9%
Herefordshire, County of 51,622 56.8%
North Northamptonshire 77,148 56.8%
Bradford 100,094 56.7%
Warrington 47,475 56.6%
Wigan 74,526 56.5%
Burnley 19,251 56.5%
Worthing 27,152 56.5%
Halton 28,334 56.4%
Harlow 16,564 56.3%
North East Lincolnshire 36,994 56.1%
Charnwood 38,455 56.0%
Basingstoke and Deane 37,807 56.0%
Brighton and Hove 50,029 55.8%
Redcar and Cleveland 33,923 55.7%
Portsmouth 36,983 55.6%
Thurrock 30,482 55.6%
Blackburn with Darwen 27,175 55.6%
Stevenage 17,133 55.5%
Forest of Dean 23,106 55.5%
Cambridge 19,375 55.3%
Boston 15,807 55.3%
Hinckley and Bosworth 27,262 55.3%
Liverpool 87,963 55.3%
Redditch 17,731 55.3%
Norwich 23,636 55.2%
North Devon 25,820 55.1%
Rochdale 43,348 55.0%
Lincoln 17,181 54.8%
Hyndburn 16,844 54.7%
Gateshead 43,928 54.7%
Leicester 52,914 54.6%
Sandwell 58,500 54.5%
Ryedale 15,429 54.4%
Manchester 68,153 54.3%
Oldham 44,208 54.2%
Knowsley 31,444 54.1%
South Holland 23,428 54.0%
Greenwich 41,308 53.9%
Barnsley 53,998 53.5%
Tunbridge Wells 25,633 53.4%
Birmingham 173,206 53.4%
Wolverhampton 48,690 53.3%
South Hams 24,493 53.2%
Ealing 56,198 53.1%
Redbridge 47,372 52.9%
Great Yarmouth 23,863 52.9%
Torridge 18,602 52.5%
Lambeth 40,369 52.4%
Southampton 37,849 52.4%
Bracknell Forest 22,488 52.2%
North West Leicestershire 22,427 51.7%
Medway 50,452 51.5%
Pendle 17,798 51.2%
Plymouth 49,986 51.0%
Swale 30,172 50.7%
Hartlepool 19,240 50.6%
Slough 19,346 50.1%
Waltham Forest 37,326 49.8%
Luton 29,997 49.0%
Kensington and Chelsea 26,574 48.3%
Southwark 38,208 48.3%
Croydon 61,425 48.1%
Islington 26,550 47.9%
Brent 47,207 47.8%
Hammersmith and Fulham 24,136 47.7%
Lewisham 37,948 47.7%
Haringey 34,805 47.4%
Camden 33,913 45.1%
Hastings 17,529 45.1%
Barking and Dagenham 22,728 44.0%
Nottingham 38,395 43.9%
Westminster 32,160 41.5%
City of London/Hackney 24,869 39.0%
Newham 29,932 38.6%
Tower Hamlets 20,653 34.6%
Join our commenting forum
Join thought-provoking conversations, follow other Independent readers and see their replies
Comments