Your support helps us to tell the story
From reproductive rights to climate change to Big Tech, The Independent is on the ground when the story is developing. Whether it's investigating the financials of Elon Musk's pro-Trump PAC or producing our latest documentary, 'The A Word', which shines a light on the American women fighting for reproductive rights, we know how important it is to parse out the facts from the messaging.
At such a critical moment in US history, we need reporters on the ground. Your donation allows us to keep sending journalists to speak to both sides of the story.
The Independent is trusted by Americans across the entire political spectrum. And unlike many other quality news outlets, we choose not to lock Americans out of our reporting and analysis with paywalls. We believe quality journalism should be available to everyone, paid for by those who can afford it.
Your support makes all the difference.Pay for the poorest fifth of men has been flat for twenty years, according to a new report for the Institute for Fiscal Studies.
At the same time the proportion of this low-paid group working part time, rather than full time, has shot up from 10 per cent to 25 per cent over the same period.
The research helps explain what has become something of an inequality puzzle in the UK, in which official headline gauges have shown flat-lining income inequality since the early 1990s and yet there is simultaneously a widespread impression that inequality has been rising strongly.
Zero wage growth for the bottom fifth of men
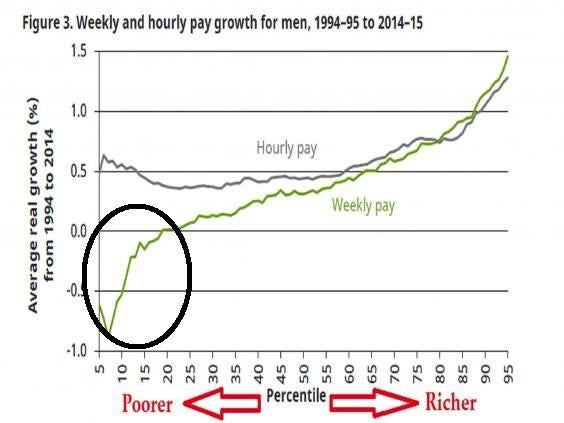
The IFS research shows that average inflation-adjusted annualised weekly pay growth for the lowest fifth of the male income distribution was zero or less between 1994-95 and 2014-15, while for men further up the income distribution real weekly pay has grown.
And while part-time work among the lowest paid men has ballooned, rates have not changed for better paid men.
This all means that among working men wage inequality has increased over the past two decades.
"The rise in household earnings inequality has been the product of a complex set of interactions between trends in hours and wages for men and women, but it is largely due to a rise in male earnings inequality," said the IFS report.
The most commonly cited snapshot of UK income inequality – the Gini coefficient – rose sharply in the 1980s under Margaret Thatcher's government but has been flat or even slightly falling since then, prompting many commentators to claim that talk of rising inequality is a myth.
Office for National Statistics data released earlier this week showed one estimate of the Gini at its lowest level in 30 years in 2015-16.
25 per cent of low-paid men now work part-time

The IFS said that the discrepancy between the chronic weakness of pay for low-paid men and the overall stability of the inequality measures was due to several factors including more women entering the workforce, a fall in workless-ness, increasing cash benefits offsetting the weakness in wages and stronger income growth for pensioners thanks to higher private pensions and a more generous state pension.
"These trends represent key changes in inequalities in their own right, despite the fact that, together, they have led to relatively moderate changes in overall household income inequality," said the report.
The IFS work shows that female wages have closed some of the gap on male wages over the past two decades and that, in contrast with men, wage inequality among women has fallen.
Jonathan Cribb of the IFS said: "The number of low-wage men working part time has increased sharply over the last twenty years. To understand the drivers of inequality in the UK it is vital to understand the growing association between low hourly wages and low hours of work among men."
The IFS excluded the bottom 5 per cent of the population in its latest research due to doubts about the accuracy of the data, which is collected from household surveys.
It also excluded the top 5 per cent from its latest analysis, for a similar reason. Researchers agree that household surveys of income and wealth do not tend to capture the very wealthiest families properly.
But the think tank cited previous empirical work, which shows that while overall income inequality has been broadly flat in recent decades, the total income share of the top 1 per cent of earners continued to rise sharply over the 1990s and 2000s.
Rising share for the wealthiest
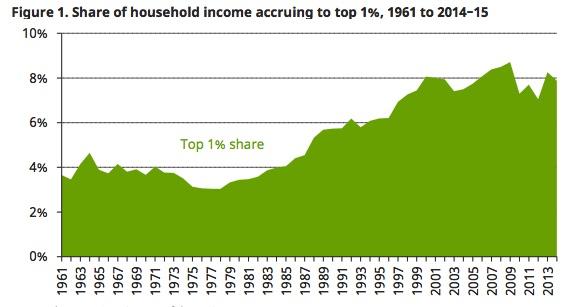
The share of the top 1 per cent of households rose from 6 per cent in 1994-95 to 8 per cent in 2014-15.
Join our commenting forum
Join thought-provoking conversations, follow other Independent readers and see their replies
Comments