We won’t solve the cost-of-living crisis if we can’t measure it
Inflation figures have long concealed people’s lived experience – but things could soon change, suggests Phil Thornton


A popular joke among statisticians has a person with her feet in an oven and her head in a freezer, saying: “On average, I feel fine.”
But there is little humour to be found in the UK consumer price inflation statistics. The headline official measure of annual inflation rose to a 30-year high of 5.4 per cent in December.
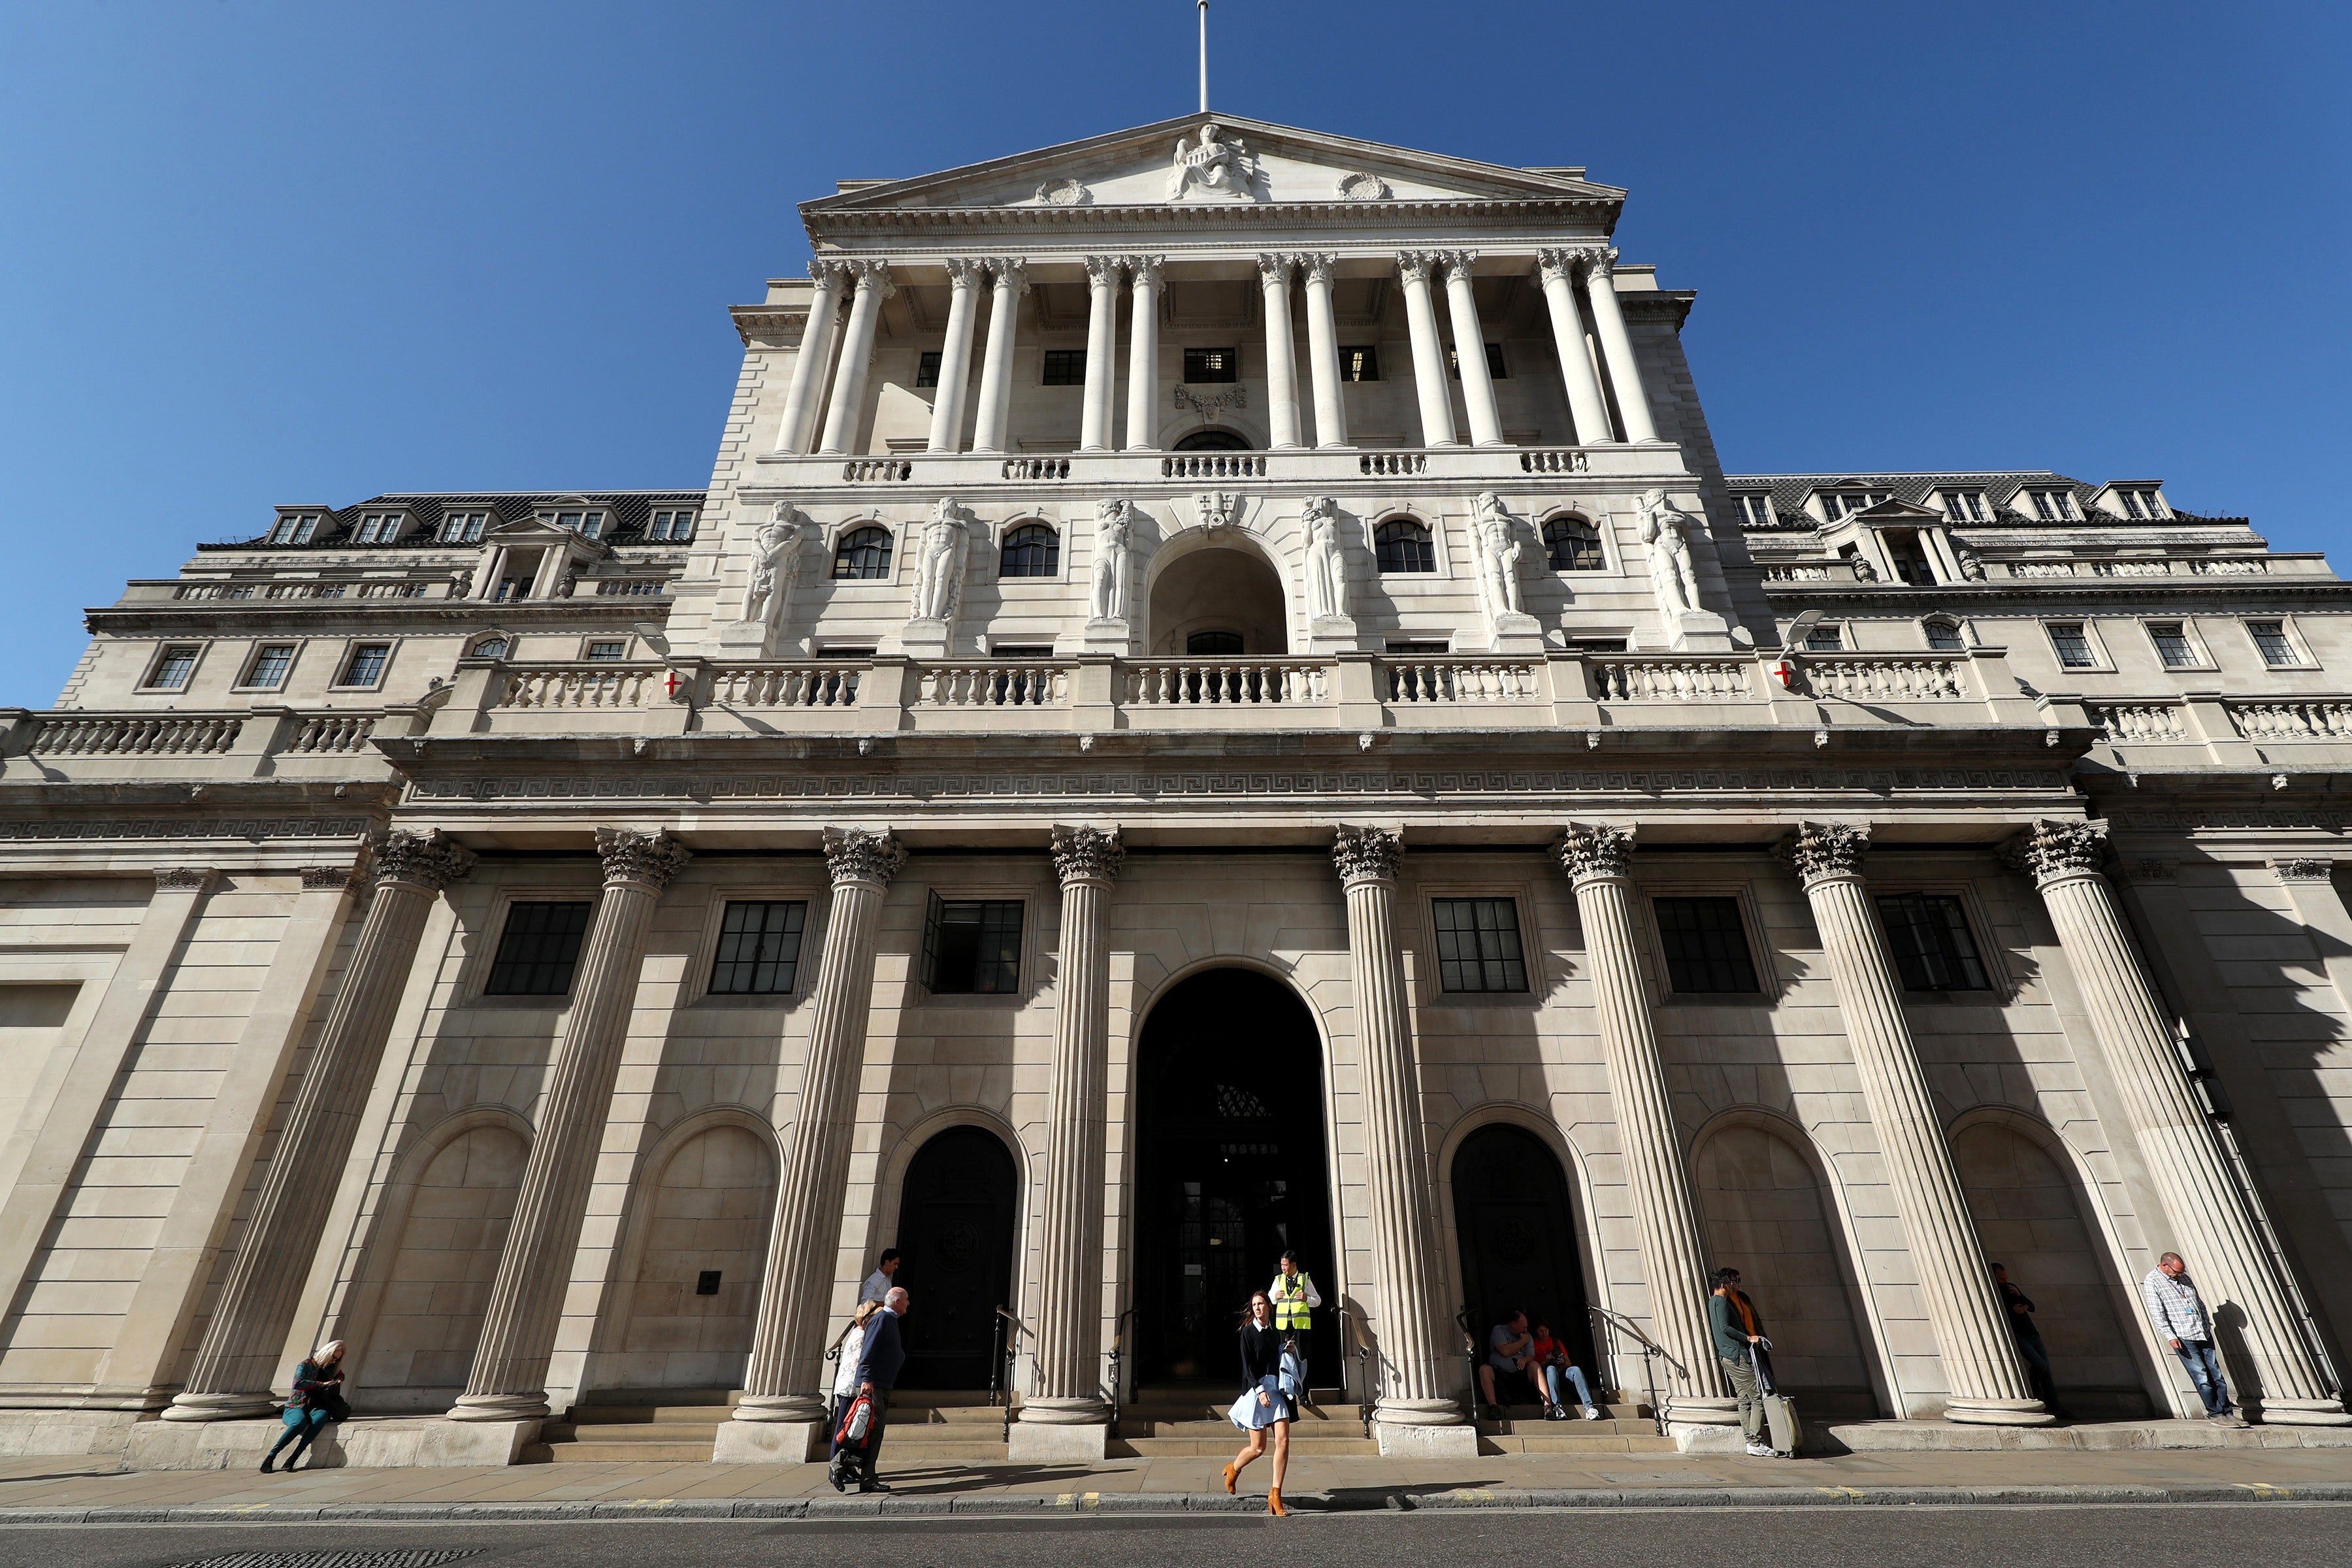
This is the rate targeted by the Bank of England’s monetary policy and explains why it is raising interest rates to prevent a runaway spike in price rises, which could in turn trigger calls for matching wage increase claims. But, of course, that figure is only an average and thus vulnerable to the weakness highlighted in the opening to this piece.
The reason that matters is that inflation is used by the government to raise the level both of benefits paid to some households and of taxes and payments imposed on others.
And here is the rub: there is not one official measure of inflation but three. While the Bank focuses on the consumer price inflation (CPI), the Office for National Statistics (ONS) also produces the retail price inflation (RPI) index – even though it is no longer an official statistic – and in fact prefers CPIH that includes housing costs, a measure that is ignored by the media and economists.
In the same month that CPI was 5.4 per cent, the CPIH was 4.7 per cent and the RPI was 7.5 per cent, a massive range of 2.8 percentage points between the lowest and highest – more than the CPI was for the year to July (2.1 per cent). This matters. As the House of Lords’ economic affairs committee has pointed out, the government tends to use RPI to raise revenue and the CPI when paying out.
Taxes linked to RPI include air passenger duty, alcohol duty, tobacco duty, vehicle excise duty, regulated rail fares and the student loan interest rate. Payments that go up by CPI include state benefits, fuel benefits for vans, index-lined savings certificates, state and public sector pensions, and tax thresholds (which determine when you move into a higher band). Oddly, Ofwat uses CPIH to set controlled water prices.
More importantly, none of these rates can provide an accurate picture for everyone. Each household has its own inflation rate, based on what it spends its money on. This in turn will vary according to a range of factors such as the size and make-up of their family, what its members spend their money on and, sometimes, where they live.
While that might seem obvious, it took the intervention of chef and anti-poverty campaigner Jack Monroe to highlight the failure of policymakers and media to focus solely on the average and miss the pressures borne by the poorest households facing a 141 per cent jump in the cost of dry pasta.
The inflation measure will tend to over-represent the behaviour of more well-off households and they do proportionately more spending (as they have more money). To its credit, the ONS’s head of inflation statistics responded with a blog post announcing it would restart posting more detailed inflation data as part of ongoing work to improve its statistics.
A few days later it did and concluded that high-income households have experienced similar inflation (5.5 per cent) to low-income households (5.3 per cent). But it went on to say that low-income families experience different inflation: rising prices of household-related costs such as water, electricity and gas, on which they spend a higher share of their income.
The reason for richer households’ inflation was rises in the cost of restaurants and hotels, furniture and household goods, and recreation and culture.
As Jack Leslie, a senior economist at the Resolution Foundation, pointed out, the looming rise in the energy price cap to £1,971 in April will disproportionately affect families already struggling to get by. “These families should be the priority for the government’s cost-of-living crisis response,” he says. The government has responded in the form of a £350 payment for households – but a lot will have to be paid back.
Looking ahead, the technology exists to enable statisticians to capture more finer-tuned data. The ONS is working on plans to increase the number of price points surveyed from 180,000 a month to hundreds of millions. That will not immediately include a change in the items chosen by each income bracket – Monroe’s main point – but it is working on that, too.
Johnny Runge, principal social researcher at the National Institute of Economic and Social Research, says a “personal inflation calculator” would be useful as the aggregate number is most arguable only for the Bank of England.
“One day, when we have good official data on this, it opens up new and important policy questions for policymakers, about how to potentially adjust for differential changes in cost of living, for different groups, [and] different regions,” he says.
In time more accurate figures will reveal people’s lived experience of inflation, enabling government to deliver targeted help. Whether it will do so, is another matter.


Join our commenting forum
Join thought-provoking conversations, follow other Independent readers and see their replies
Comments