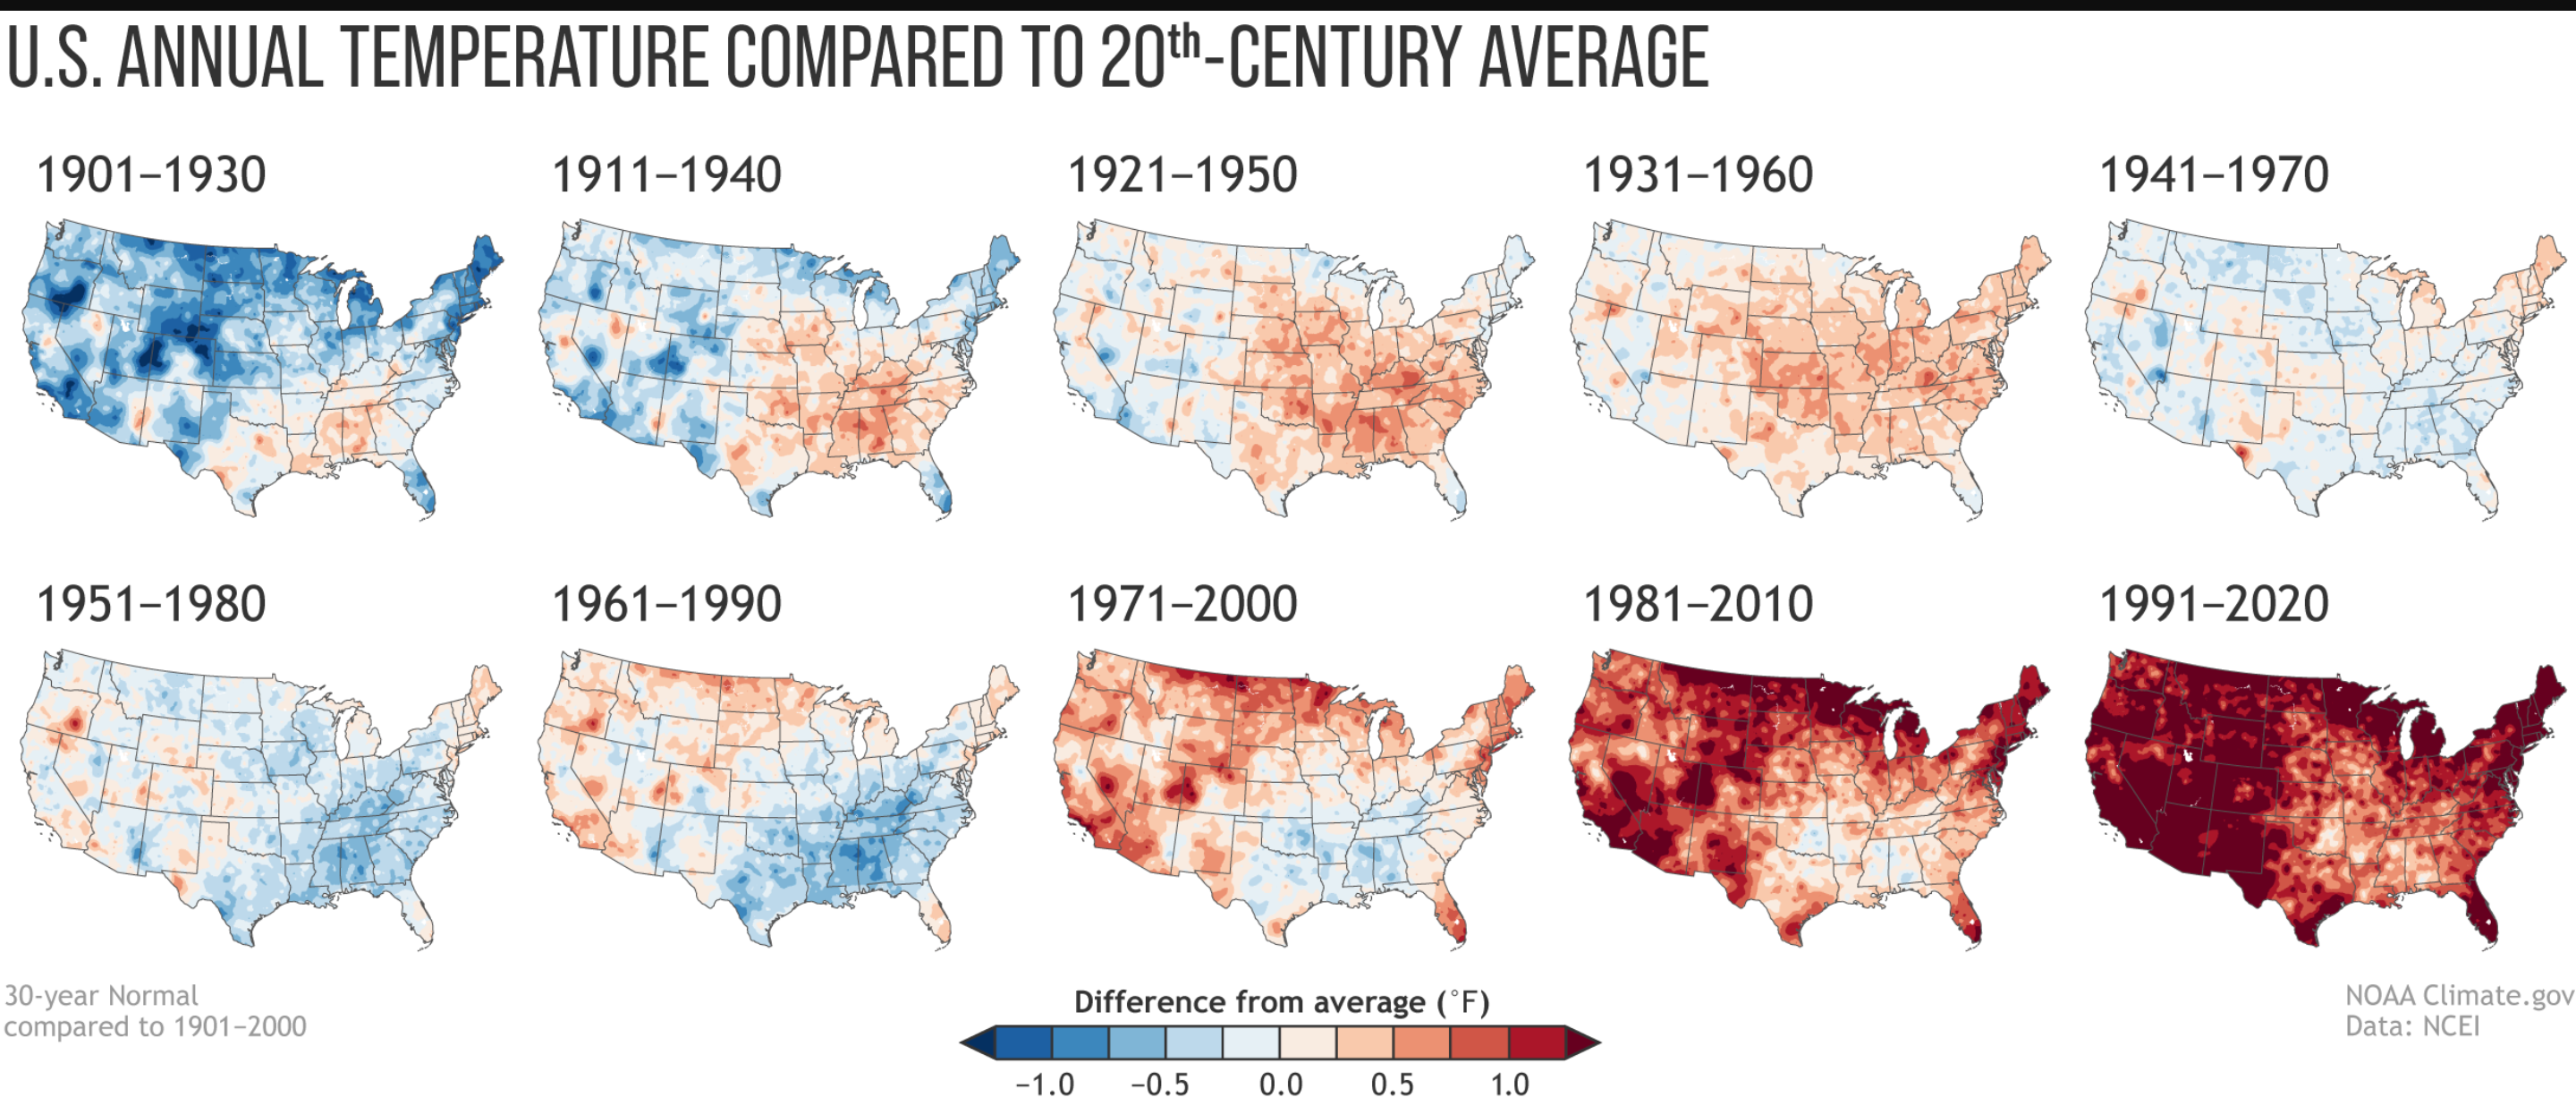
America hotter than ever, latest NOAA data reveals
The climate crisis is creating a new normal in temperatures across the US

Your support helps us to tell the story
From reproductive rights to climate change to Big Tech, The Independent is on the ground when the story is developing. Whether it's investigating the financials of Elon Musk's pro-Trump PAC or producing our latest documentary, 'The A Word', which shines a light on the American women fighting for reproductive rights, we know how important it is to parse out the facts from the messaging.
At such a critical moment in US history, we need reporters on the ground. Your donation allows us to keep sending journalists to speak to both sides of the story.
The Independent is trusted by Americans across the entire political spectrum. And unlike many other quality news outlets, we choose not to lock Americans out of our reporting and analysis with paywalls. We believe quality journalism should be available to everyone, paid for by those who can afford it.
Your support makes all the difference.The climate crisis is creating a new normal in America - and it’s hotter than ever, according to new federal data released on Tuesday.
The National Oceanic and Atmospheric Administration (NOAA) published an updated set of climate averages, or “climate normals”, for 1991-2020.
The data is compiled using around 8,700 National Weather Service stations and gives Americans a way of comparing today’s conditions where they live with the last 30 years.
The figures, updated about once a decade, give a picture of the US as a whole and also break down the variations in averages from place to place.
NOAA’s Michael Palecki, who oversaw the project, confirmed to The Washington Post that in the 48 contiguous states - that is, excluding Alaska and Hawaii - the 30-year average temperature in the most recent three-decade period reached a record 11.8C (53.28 degrees Fahrenheit).
At the beginning of the 21st century, “normal” was 11.3C (52.3F), according to NOAA’s 1971-2000 data. The 20th century’s average US temperature was 11.1C (52F).
Since the first dataset was collected in the period 1901-1930, around 1C of warming has taken place in the contiguous US, a similar rise to the rest of the world.
Of the 10 versions produced by NOAA, the two most recent 30-year periods have seen the biggest rises in temperatures.

The current normal annual US temperature is 0.9C (1.7F) higher than the first normal calculated in the early 20th century.
“The newly-announced @NOAA ‘climate normals’ indicate that things are ANYTHING but ‘normal’ when it comes to the climate crisis,” tweeted climate scientist and author Michael Mann.
Ahead of the new data being released NOAA noted last month how, over time, the “normal” annual US temperature has become hotter, and at the same time, “normal” annual precipitation has increased.
Drill down deeper into the data, and there is further confirmation of what daily weather forecasts have suggested - that rising global heat isn’t affecting all places the same.
Eastern and Central states are now wetter than 10 years ago, and the West is coping with drier conditions.
And while the 1991-2020 Climate Normals revealed most times of year and most regions are hotter, there were exceptions. The North Central US region temperatures are cooler than in the 1981–2010 period, particularly towards the end of winter.
Join our commenting forum
Join thought-provoking conversations, follow other Independent readers and see their replies
Comments