Climate change graph ‘needs more colours’ as world gets hotter
The past 30 years have seen increased global warming, the graphic shows

Your support helps us to tell the story
From reproductive rights to climate change to Big Tech, The Independent is on the ground when the story is developing. Whether it's investigating the financials of Elon Musk's pro-Trump PAC or producing our latest documentary, 'The A Word', which shines a light on the American women fighting for reproductive rights, we know how important it is to parse out the facts from the messaging.
At such a critical moment in US history, we need reporters on the ground. Your donation allows us to keep sending journalists to speak to both sides of the story.
The Independent is trusted by Americans across the entire political spectrum. And unlike many other quality news outlets, we choose not to lock Americans out of our reporting and analysis with paywalls. We believe quality journalism should be available to everyone, paid for by those who can afford it.
Your support makes all the difference.The climate scientist behind a renowned global-warming stripe graphic said he’s going to need more colours to represent the warmer world of the future.
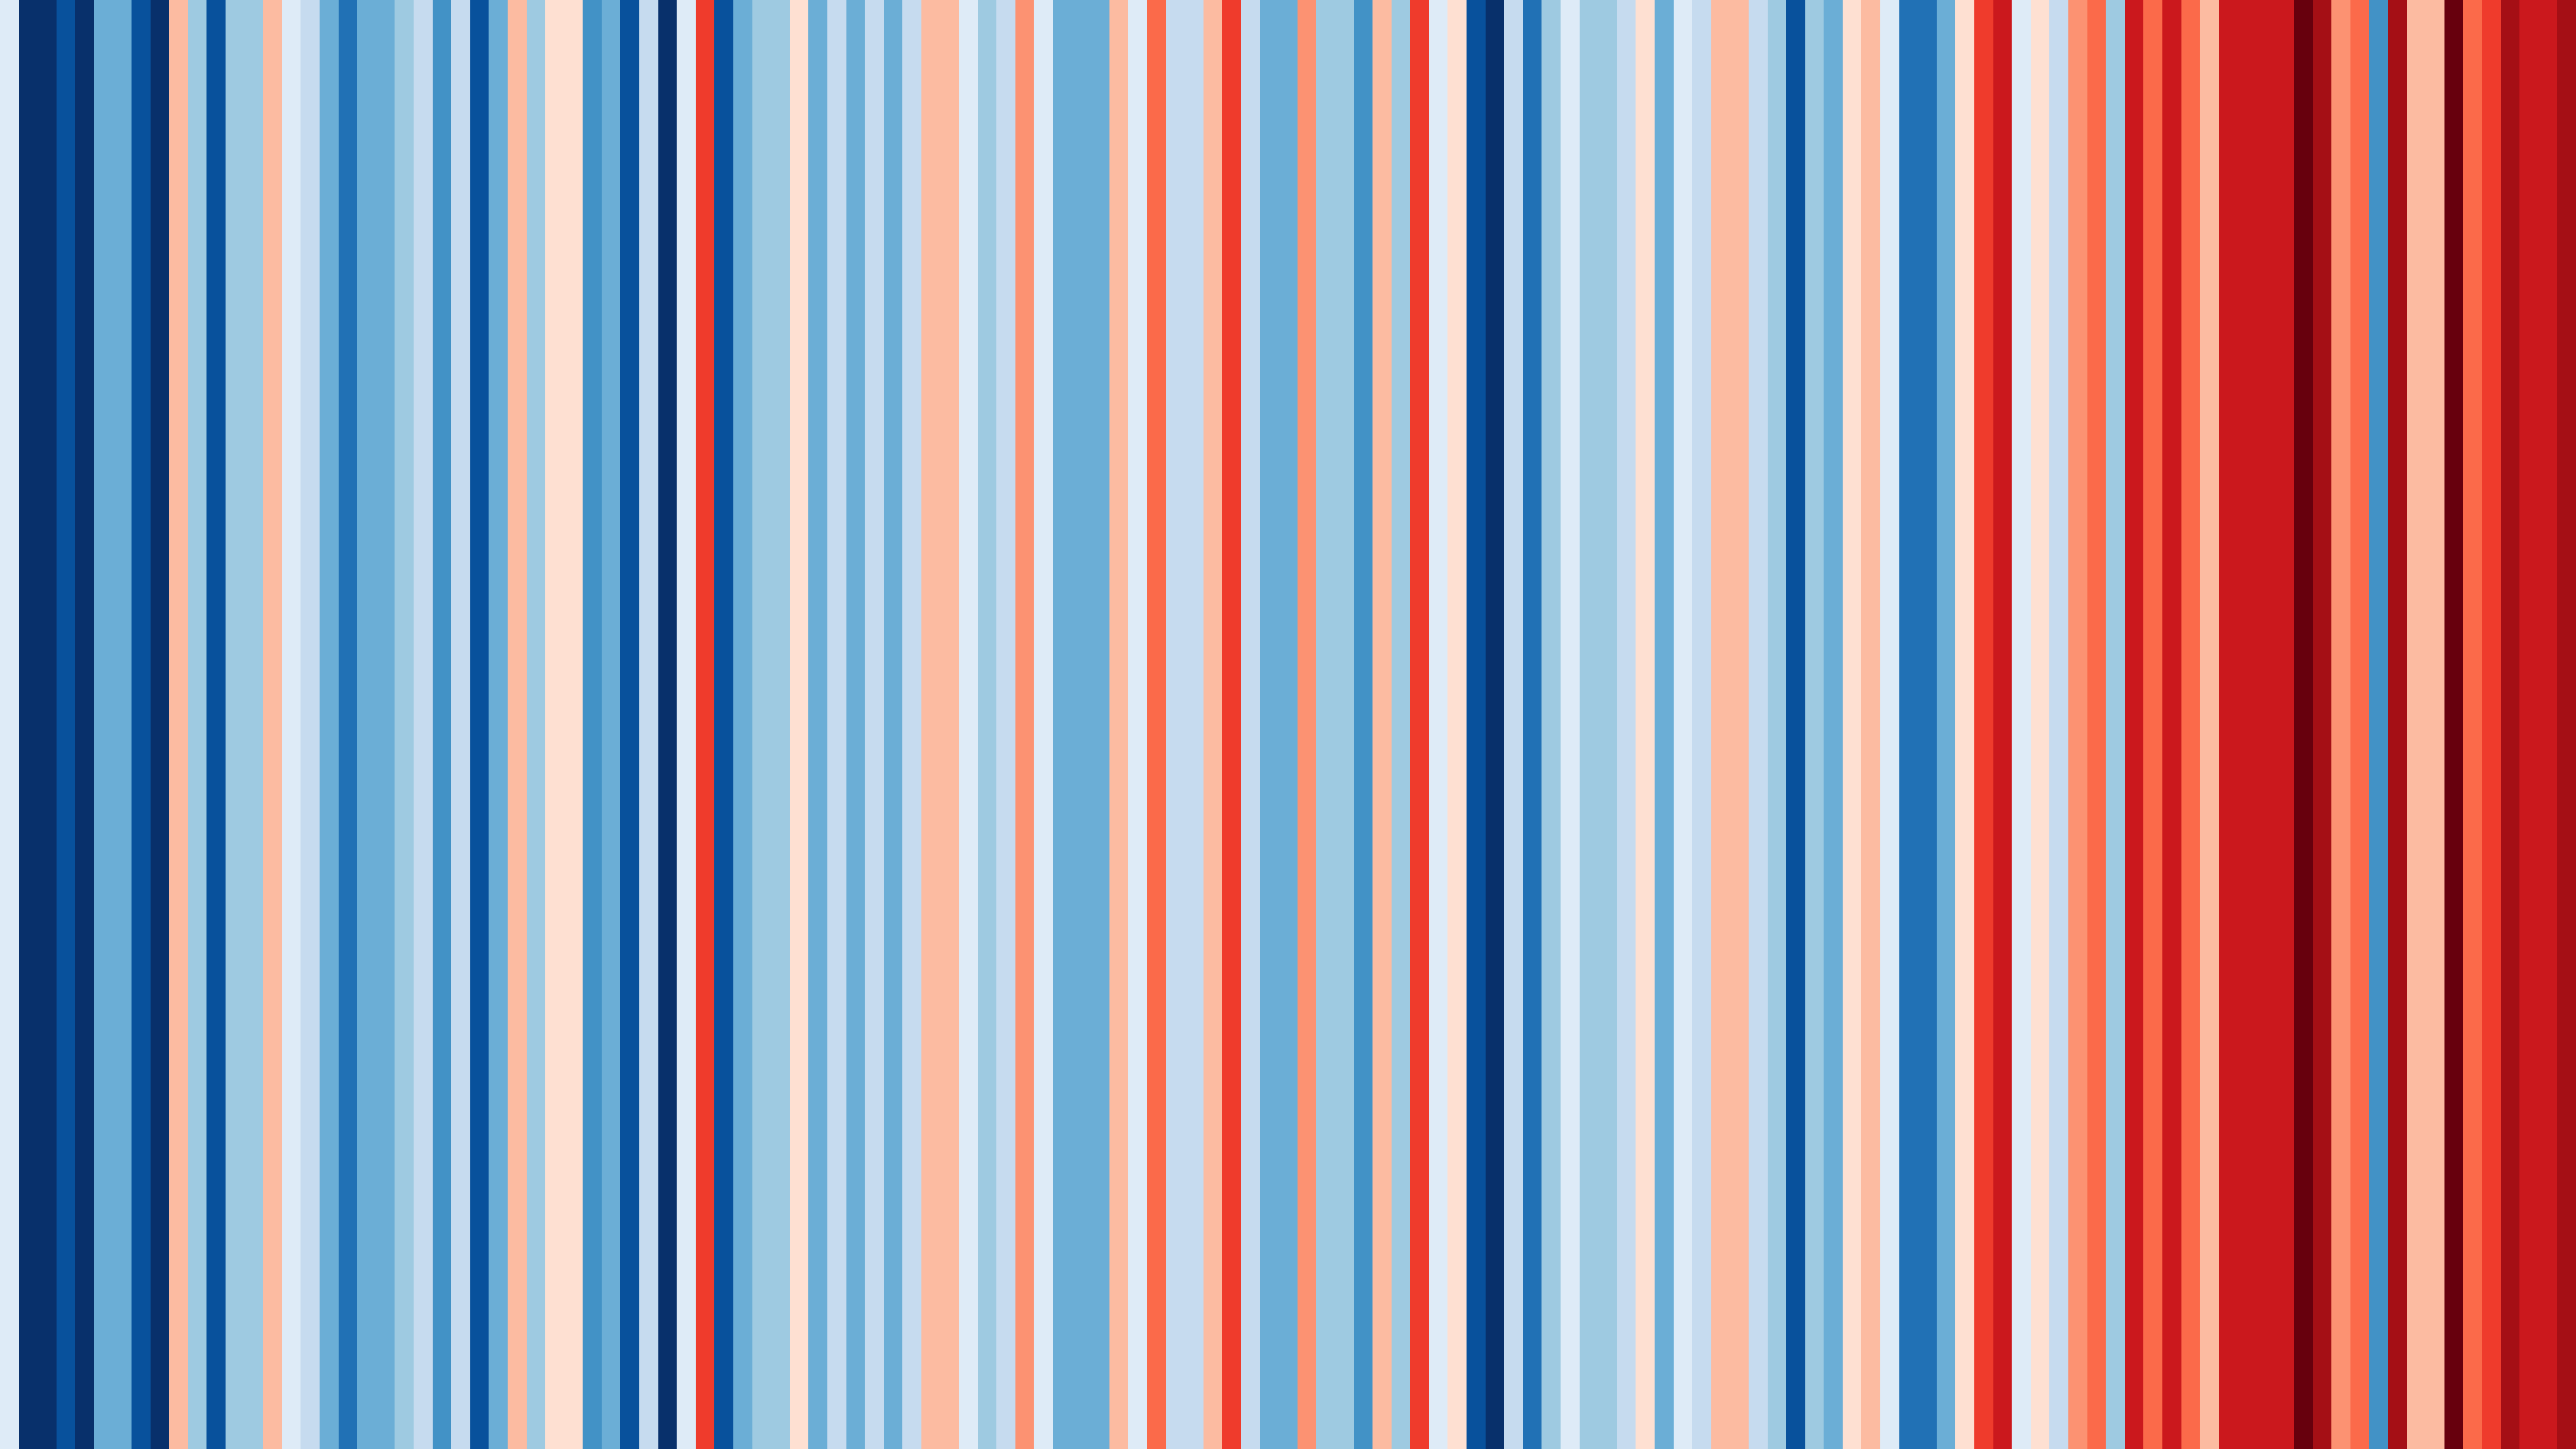
Professor Ed Hawkins designed the visualisation which has been used globally as a symbol for climate change. Each line represents the average temperature in a year with blue-coloured lines indicating colder temperatures and red indicating warmer.
Professor Hawkins’ told the BBC that the colours of the graph will get darker and choices made at the Cop26 summit will determine how dark it gets.
The graphic was first used by the Reading University professor at the Hay Festival in 2018.
“I was looking for a way of very simply communicating the fact that our planet is warming and so I made a set of stripes for Hay,” the meteorologist said.
“I could instantly see that members of the audience realised that something was happening and they could instantly visualise the fact that the planet was warming and that was affecting Hay itself.”
Warming stripes are now available for every country in the world showing how each nation’s average temperature has changed over the years. The past 30 years have been the warmest on record, according to the warming stripes.

The warming stripes for Wales from 1884 to 2020 showed predominantly blue stripes between 1890 and 1980 but increasingly red and dark red thereafter.
“This information is critical for policymakers to make decisions. It indicates that Wales has warmed about 1.5 times faster than the global average,” Professor Hawkins said. “So, for every two degrees [Celsius] increase in global temperature, Wales will rise by about three degrees.”
In efforts to reduce impacts of climate change, more than 100 nations will make a promise during Cop26 to stop deforestation and begin restoring the world’s forests by 2030, the UK government has said. It’s one of the first major international agreements of the landmark climate summit.
India has set out a net-zero emissions target for 2070, the country’s prime minister Narendra Modi has told the UN’s Cop26 climate summit.
India’s 2070 deadline is 10 years later than China’s 2060 goal, and 20 years behind the 2050 date the IPCC has said the world must hit to keep global average temperatures from soaring 1.5C above what they were in the pre-industrial era.
Join our commenting forum
Join thought-provoking conversations, follow other Independent readers and see their replies
Comments