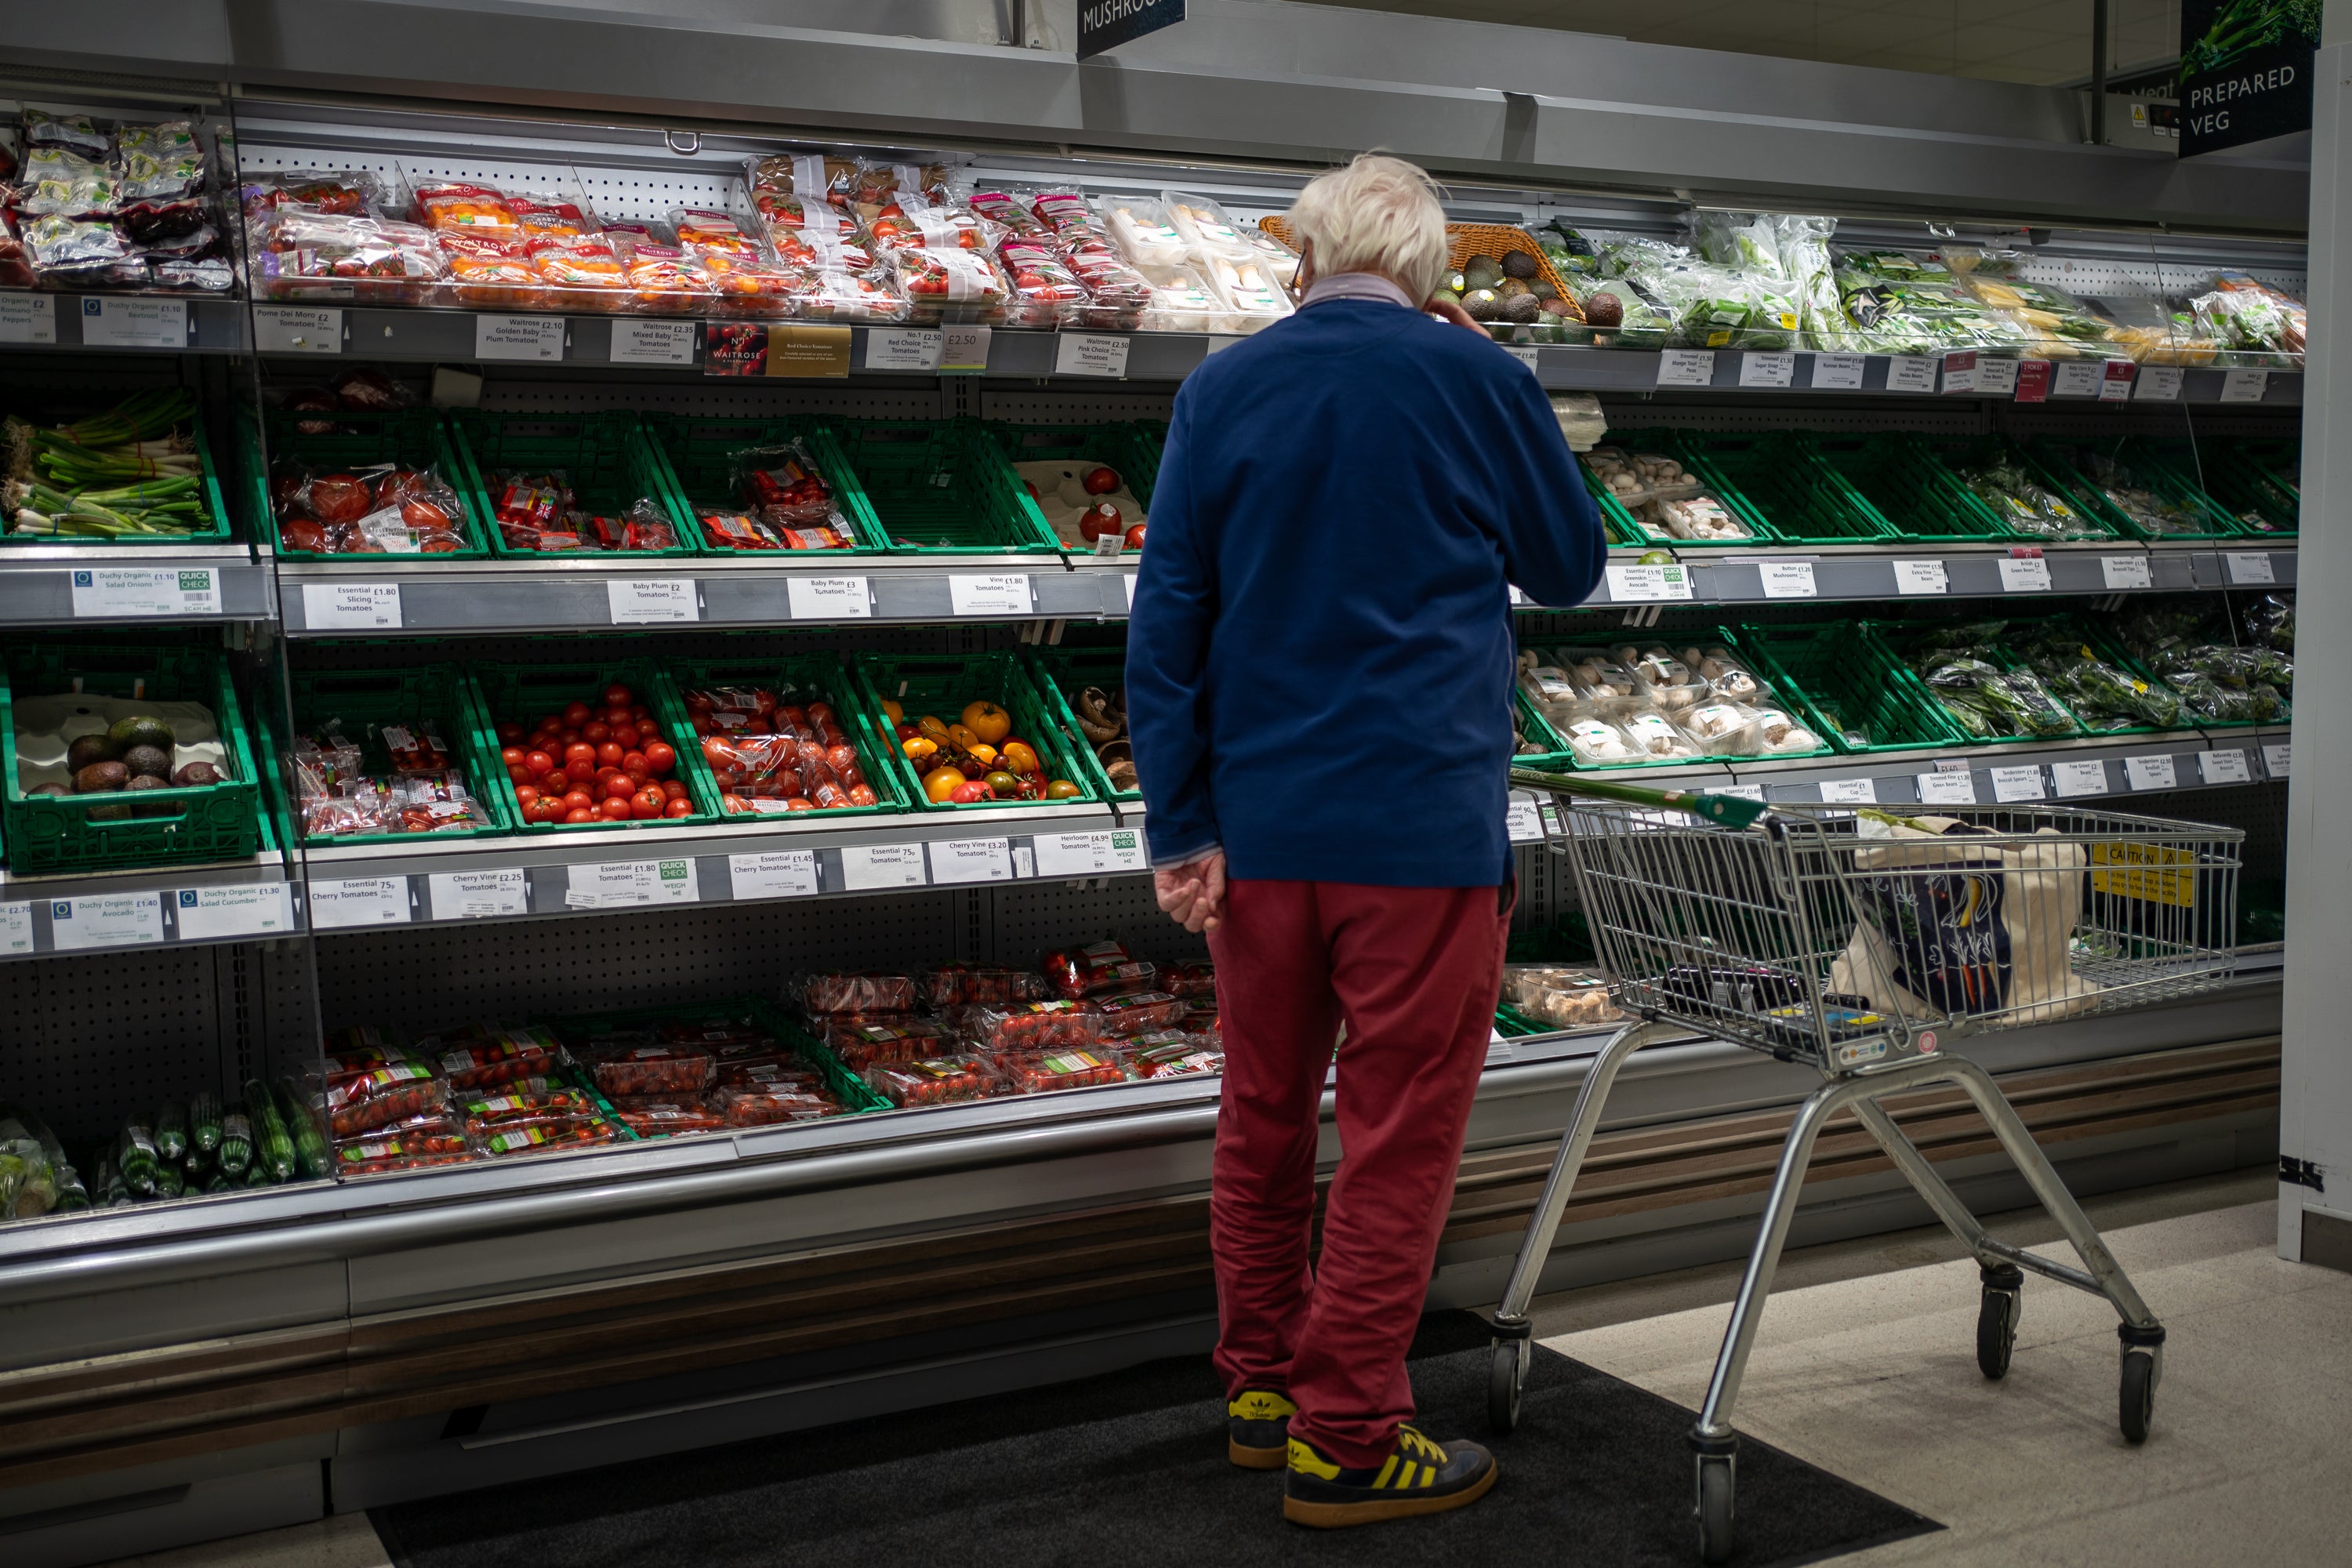
How everyday items have risen in price in the past 12 months
The cost of low-fat milk has increased by 34.0%, butter by 27.1% and potatoes by 15.7%.

Your support helps us to tell the story
From reproductive rights to climate change to Big Tech, The Independent is on the ground when the story is developing. Whether it's investigating the financials of Elon Musk's pro-Trump PAC or producing our latest documentary, 'The A Word', which shines a light on the American women fighting for reproductive rights, we know how important it is to parse out the facts from the messaging.
At such a critical moment in US history, we need reporters on the ground. Your donation allows us to keep sending journalists to speak to both sides of the story.
The Independent is trusted by Americans across the entire political spectrum. And unlike many other quality news outlets, we choose not to lock Americans out of our reporting and analysis with paywalls. We believe quality journalism should be available to everyone, paid for by those who can afford it.
Your support makes all the difference.Here are some examples of how the cost of everyday goods and services have risen in the past year.
The figures are based on the Consumer Prices Index (CPI) measure of inflation and have been published by the Office for National Statistics.
In each case, the figure is the percentage change in the average price over the 12 months to July 2022.
– FoodLow-fat milk 34.0%Butter 27.1%Pasta and couscous 24.4%Olive oil 23.6%Margarine and other vegetable fats 22.5%Jams, marmalades and honey 21.2%Sauces, condiments, salt, spices and culinary herbs 21.2%Cheese and curd 17.9%Ready-made meals 16.0%Potatoes 15.7%Eggs 14.6%Yoghurt 14.2%Pork 13.2%Edible ices and ice cream 12.9%Fish 12.8%Bread 11.0%Pizza and quiche 9.9%Fruit 8.5%Rice 6.7%Sugar 5.1%
– DrinksMineral or spring waters 22.0%Fruit and vegetable juices 14.8%Coffee 12.0%Tea 10.2%Soft drinks 7.7%Beer 3.2%Spirits 3.1%Wine 2.5%
– Clothing and shoesClothing accessories 7.7%Garments for men 7.4%Garments for infants and children 7.4%Footwear for infants and children 7.3%Garments for women 6.4%Footwear for women 5.5%Footwear for men 3.9%
– Electricity, gas and other fuelsLiquid fuels 114.1%Gas 95.7%Electricity 54.0%Solid fuels 26.9%
– Household items and furnitureGarden furniture 21.1%Heaters and air conditioners 18.2%Irons 14.8%Refrigerators, freezers and fridge-freezers 13.2%Glassware and chinaware 12.8%Cookers 8.5%Bed linen 8.1%Lighting equipment 7.9%Carpets and rugs 4.9%
– VehiclesSecond-hand cars 8.6%New cars 7.3%Bicycles 6.1%Motorcycles 2.3%
– Passenger transportBy air 37.1%By train 9.8%By underground and tram 5.1%By bus and coach 3.8%By sea and inland waterway 3.0%
– Hospitality and recreationHoliday centres, camping sites and youth hostels 25.5%Cinemas, theatres and concerts 14.0%Fast food and takeaway food services 10.3%Restaurants and cafes 7.5%Canteens 6.3%Museums, libraries and zoological gardens 5.0%
– Other recreational itemsGarden products 15.1%Products for pets 13.7%Equipment for sport 11.7%Veterinary and other services for pets 9.1%Equipment for sport 8.6%Plants and flowers 6.6%