Data increasingly important as Twenty20 continues its journey from novelty format to big business
With the realisation that Twenty20 is exceptionally conducive to detailed data analysis, the format is no longer the light-hearted frolic it was initially perceived to be

Sign up to our free sport newsletter for all the latest news on everything from cycling to boxing
Sign up to our free sport email for all the latest news
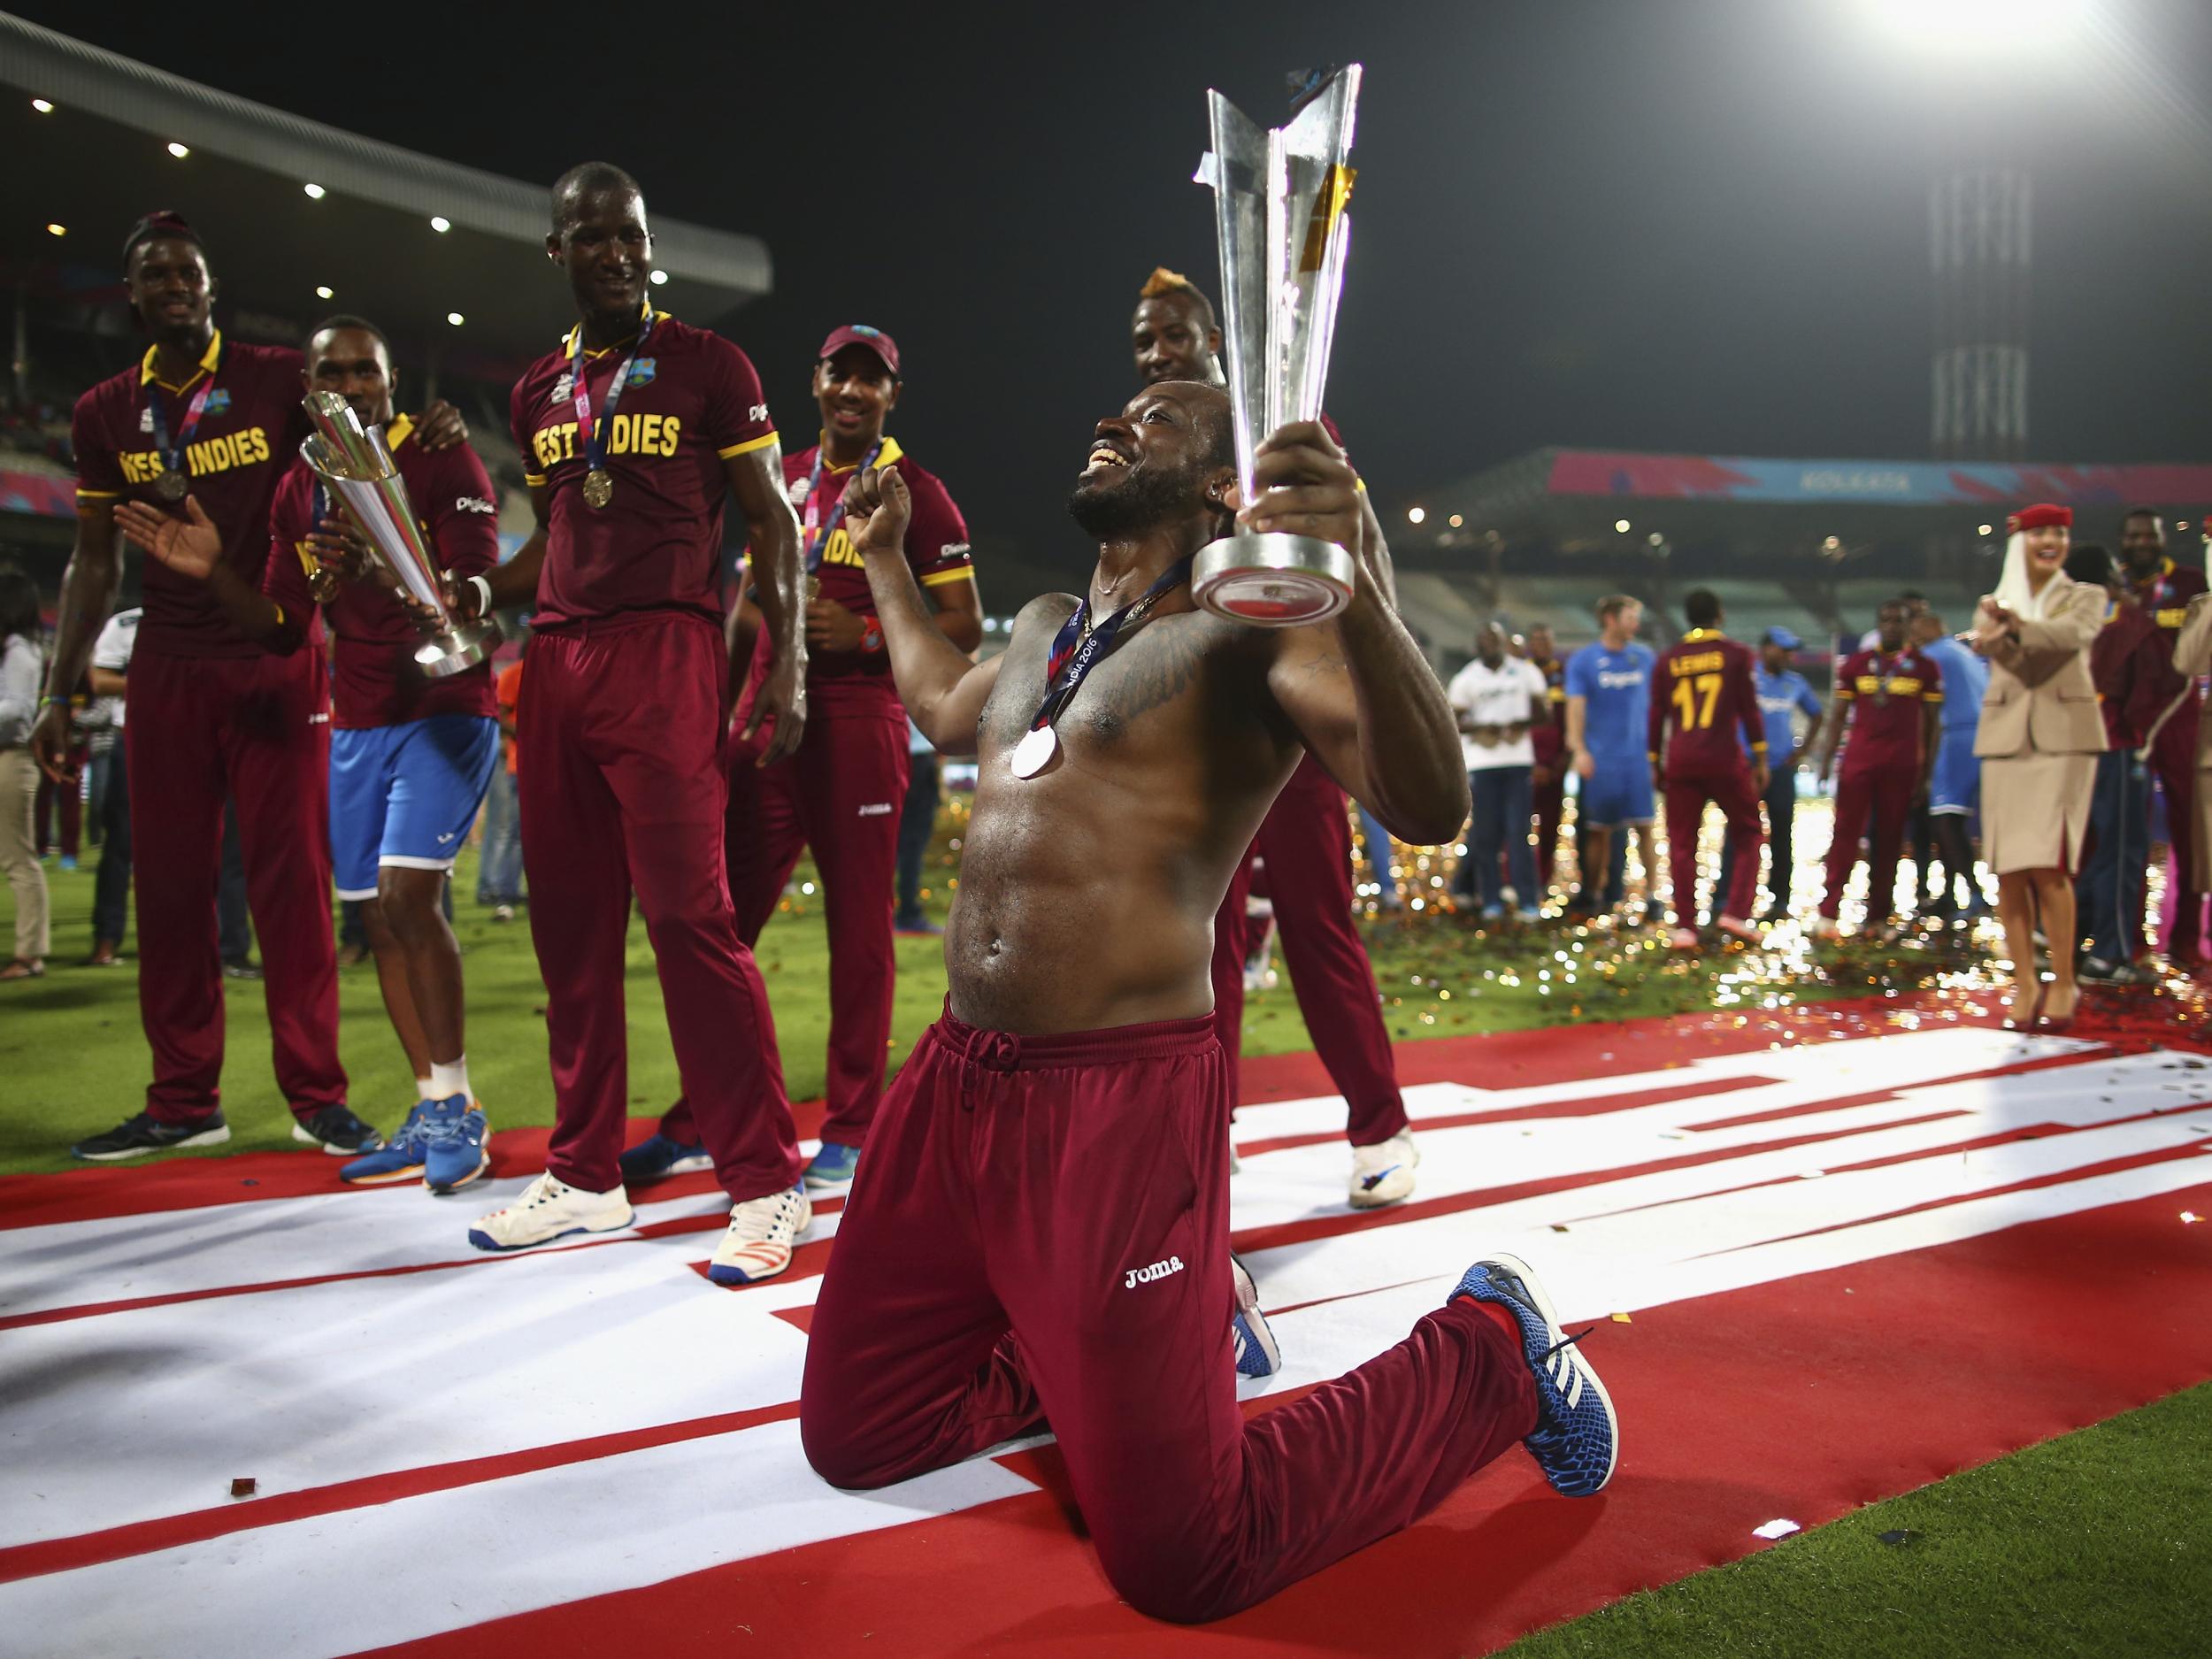
A year ago, England’s hierarchy were plotting how to remove Chris Gayle in the World Twenty20. Then a curious suggestion was raised: opening the bowling with Joe Root.
Among those involved in this conversation was Nathan Leamon, England’s team analyst. Leamon confirmed that Gayle did indeed have a poor record against offspin, particularly in the batting Powerplay, showing that this gut feel had an empirical base too.
And so, when Root opened the bowling in the final, promptly dismissed Gayle and took two wickets in the first over, a little of the credit should have gone to Leamon and the broader concept: how data can aid teams in Twenty20 cricket.
All of this seemed unimaginable when Twenty20 cricket was launched in the summer of 2003 in England. This was a light-hearted frolic, complete with pitchside jacuzzis, cheerleaders and speed dating.
Away from the gimmicks, the tournament was won by Surrey - not through any great tactical wheezes, but because they had the best players. "We're going to bowl first," Surrey captain Adam Hollioake said when they won the toss in the first match, "because I haven't got a clue what's going to happen".
But, even in the bedlam of T20’s first years, there were glimpses of sides recognising what could be achieved by taking the game a little more seriously. John Inverarity, the coach of Warwickshire, used to bellow ‘twos’ to his players, reflecting a belief that the side who scored the most twos would win. His side reached the final in 2003.
Leicestershire were the first to succeed through embracing how, for all that T20 is seen as the most instinctive, spontaneous format of the game, it lends itself best to planning. They overcame the limitations of a small playing squad and budget to triumph in the T20 Blast in 2004 and 2006. They did not exactly Moneyball T20, because the data to do so simply didn’t exist, but gave a glimpse of what was possible.
“No one had really decided how to play it. They basically just thought it was ‘slog it as far as you can and that’s it’, and that spinners wouldn’t even be a factor in the game,” recalls Charles Dagnall, now a commentator for Test Match Special.
Leicestershire took a different approach. At a time when many teams favoured opening with pinch-hitters, their batting followed a simple mantra: put the best batsman - Brad Hodge - at the top of the order so he could face the most balls. They planned where they wanted to be after the end of the six-over Powerplay. With the ball, Leicestershire attacked early on, even if it meant leaking boundaries, recognising that ultimately the best way to contain a T20 innings was to take regular wickets.
They played with two frontline spinners - Claude Henderson and Jeremy Snape - with Hodge offering an extra spin option, and extended the boundaries at Grace Road to make the spinners harder to hit; sometimes, Hodge would even open the bowling with his offspin.
They put mandatory men in the 30-yard circle to save one, rather than leaving them on the edge of the circle, reasoning that they could not afford to let the opposition score off every ball of the innings.
And they used Dagnall’s in-swing in the middle overs, believing that it was harder to hit for batsmen to free their arms than against outswingers. Now, none of these steps look revolutionary, but these strategies were “ahead of our time”, says Dagnell.
In the years since, it has gradually dawned on teams that T20 is the format most conducive to using data. Just before T20 was created, Cricket Australia enlisted sports analytics company to study statistics, to see if there was a way of using them to give them the edge; the company referred to the sport as ‘‘the Monster”, overwhelmed by the sheer amount of data.
But in T20, the monster can be tamed. As a game lasts only 40-overs, it can be dissected and the scope for pre-planning is far greater than in the longer formats, where the pattern of play is more unpredictable and the possibilities are so large that it can be impossible to find meaningful comparisons to inform a team’s strategy.
The brevity of T20 also helps in another way: it means that far more matches can be played, creating a pool of data for analysts to mine. It is often said that data becomes defunct after two years, because of evolution in the sport and how individual players change but, while top Test players might play 12 Tests over two years, top T20 players can play 50 T20 matches a year. And while Test matches are played in ever-changing conditions, conditions for T20s around the world tend to be far more homogeneous: essentially, favouring batsmen over bowlers.
In both the Indian Premier League and the T20 Blast, the regular season lasts for 14 matches per side, allowing analysts to get a sense of the strengths and weaknesses of opposition teams and trends in the competition.
The remarkable record of Northants in T20 in recent years - after being the worst county in T20 cricket across 2011-12, they have reached three of the past four T20 Blast finals, winning two, despite having among the five smallest wage bills of the 18 counties - has been underpinned by analytics.
Richard Barker, their team analyst, was involved in ‘mapping out’ how the team could reach a winning score in matches, identifying their previous weaknesses: above all, a lack of boundary hitting. He compiles dossiers of 25 pages for knockout matches, dissecting the strengths and weaknesses of the opposition and identifying areas for Northants to exploit.
Captain Alex Wakely embraces Barker’s work. During matches, he sometimes even asks substitute fielders to find out Barker’s information about how an opposing batsman has been dismissed, which is pinned to Northants’ dressing room wall during every game. And, in classic Moneyball style, the team have also been astute in recognising players undervalued by other teams, often because they were unorthodox or did not look like natural athletes.
Other teams are also recognising the benefits of using data. Islamabad United, who are run by former cricket bloggers, won the inaugural Pakistan Super League last year after embracing analytics in a cricket culture not renowned for reliance on statistics. “A lot of figures got chucked around, and it helped a lot of people,” says Sam Billings, who is about to return for his second season with Islamabad United. For all the mystique of analytics, their essence is very simple: using data analysis to help make decisions more objectively and accurately.
Still, there are perils in using data. Too much reliance on numbers can stifle a team, so the coaching staff and captain must act as filters, ensuring the players only receive small amounts information they can act upon. “You don't want to sit people down for too long because they don't listen,” Wakely explained recently. “ We have to go through it, sift out the best bits of information, and feed those back to the dressing room so that it gives us the best chance of winning.”
And measuring the wrong numbers, or paying too much attention to what could just be random variation, can have disastrous results. Even with the abundance of T20 leagues, the great limitation of using data in T20 cricket remains the lack of matches. In Major League Baseball, each team play 162 games in the regular season, but in the T20 Blast and IPL they only play 14, and it is even fewer in other T20 leagues.
Still even these numbers are far better than in international T20 cricket. Besides the World Twenty20, T20I cricket is a curious entity. Matches are normally tacked onto the end of tours; ‘series’ often comprise only a game or two - England’s series in India was their first three-match encounter since 2015 - so it is often not even worth countries flying T20 specialists over for such a brief period; and, as the games have little obvious relevance or context, they are prime opportunities for teams to rest and rotate, meaning that bilateral T20Is between two countries at absolute full-strength are very rare.
The upshot is that the data revolution permeating domestic T20 cricket is far more advanced than the embrace of analytics in international T20, where there is seldom enough data to analyse meaningfully.
Sometimes data can be less an aide than an impediment. Perhaps the best warning concerns AB de Villiers’s international T20 career with South Africa. Instinctively, the obvious answer to where de Villiers should bat in T20 cricket is, as with Hodge at Leicestershire 13 years ago, at the top of the order, to allow him to face the greatest number of balls. Indeed, de Villiers made 63 in South Africa’s last T20, batting at number three.
Yet in the last two WT20 competitions, he has been used in a different role: as a finisher, a sort of upmarket Kieron Pollard. Data is to blame. After South Africa lost in the semi-finals of the 2014 WT20, a game in which de Villiers did not come in to bat until the 14th over, head coach Russell Domingo explained that he was held back because the statistics showed he was more effective coming in after the tenth over. Superficially, the theory is backed up by numbers, but the trouble is the sample size was so tiny: when Domingo said de Villiers thrived coming in late in an innings, he was referring to eight innings played over eight years. South Africa over interpreted the findings of a small amount of data.
Analytics is changing T20 cricket, and rapidly. Indeed, several of the most notable trends in T20 in recent years - the growing use of spinners, including Liam Dawson for England in Nagpur, to open the bowling, because they tend to be more economical; and the increasing preference of teams winning the toss to chase, because it increases their chances of victory - own their popularity to the statistical analysis that proves these strategies are successful.
In the coming years, fielding seems the discipline most likely to be transformed by data analysis. For all that cricket fetishises statistics, it has historically ignored fielding. Baseball has not been so lax: it has long recorded fielding statistics and is increasingly scientific in how it does so. In 2015, Major League Baseball launched Statscast, video technology that has three-dimensional snapshots of every movement on the field, converting 40,000 frames per second of footage into digital data, and thereby allowing precise measurements of the physical performance of fielders, meaning fielders can be evaluated empirically.
Now there are signs that T20, which amplifies the importance of fielding because the brevity of games reduces the margins of victory and defeat, is finally catching up.
This season, the Big Bash League introduced a fielding average which, though fairly rudimentary, amounts to the first time a professional league has systematically tried to evaluate fielding. More sophisticated is England’s method, which uses a system of expected runs saved or cost x difficulty to assign a value for each piece of fielding, allowing the fielding performances of every player to be logged. In India, that provided empirical justification for Trevor Bayliss hurling catch after catch to Jake Ball in brutal one-on-one training sessions.
CricViz, the analytics company, believe that fielding is a crucial area for growth, both in data mining and on-field performances. Only 25% of run outs requiring a direct hit in the ring are achieved. “Missing these chances is currently less notable on TV than the fumble on the boundary; team analysis is taking the lead here,” says Phil Oliver, the company’s founder. In this year’s Big Bash League, CricViz’s fielding metrics correlated strongly with overall performances of a team. The Perth Scorchers, the champions found to have saved a net of 54.70 runs in the field over their ten games, twice as many as anyone else, while the fielding of Sydney Thunder and Adelaide Strikers, who both finished in the bottom three, cost both teams 31 runs over the eight matches.
But there is still ample room for data to be used more heavily. In international T20 cricket, the ICC hopes to introduce a 13-team league, with each country playing a three match series against everyone else - 36 games each over three years, to produce a champion. Such a structure would increase both the volume and context of T20I cricket, providing more data for analysts.
In domestic cricket, too, analytics will become more important. The IPL, for instance, does not at all look like a rational marke. Part of the problem is that IPL teams are not consumed solely by winning, but also by wider commercial needs: Chris Gayle, who does not always get into Royal Challengers Bangalore’s first team, was recently retained for 75,000,000 rupees - £880,000 - but his worth is in shirts sold, not just runs scored.
But as T20 leagues, notably the Big Bash and IPL, become more cut-throat, teams will become increasingly aware of how analysts can give them an advantage. According to a recent study by 538, the number of statistical analysts across the 30 Major League Baseball teams rose from 44 to 156 from 2009 to 2016, for a simple reason: they work. %38 found that employing an extra analyst was worth about two extra wins per season to teams; these extra wins would have cost 30 times as much through spending higher salaries on players, showing how analysts are still undervalued.
Even if the process has taken longer than it should, T20 is being taken more seriously. The coming years shape as completing the format’s journey from speed dating to sabermetrics. And savvy teams will increasingly recognise that, sometimes, analysts can be the best value signings of all.
Subscribe to Independent Premium to bookmark this article
Want to bookmark your favourite articles and stories to read or reference later? Start your Independent Premium subscription today.
Join our commenting forum
Join thought-provoking conversations, follow other Independent readers and see their replies