Poor hit hardest by financial crisis and welfare cuts will make it worse
After taxes, the richest 10 per cent earned 9.5 times the income of the poorest 10 per cent in 2010
Your support helps us to tell the story
From reproductive rights to climate change to Big Tech, The Independent is on the ground when the story is developing. Whether it's investigating the financials of Elon Musk's pro-Trump PAC or producing our latest documentary, 'The A Word', which shines a light on the American women fighting for reproductive rights, we know how important it is to parse out the facts from the messaging.
At such a critical moment in US history, we need reporters on the ground. Your donation allows us to keep sending journalists to speak to both sides of the story.
The Independent is trusted by Americans across the entire political spectrum. And unlike many other quality news outlets, we choose not to lock Americans out of our reporting and analysis with paywalls. We believe quality journalism should be available to everyone, paid for by those who can afford it.
Your support makes all the difference.The poorest people in Britain have been disproportionately affected by the financial crisis and recent welfare cuts may drive up inequality levels further, according to new research.
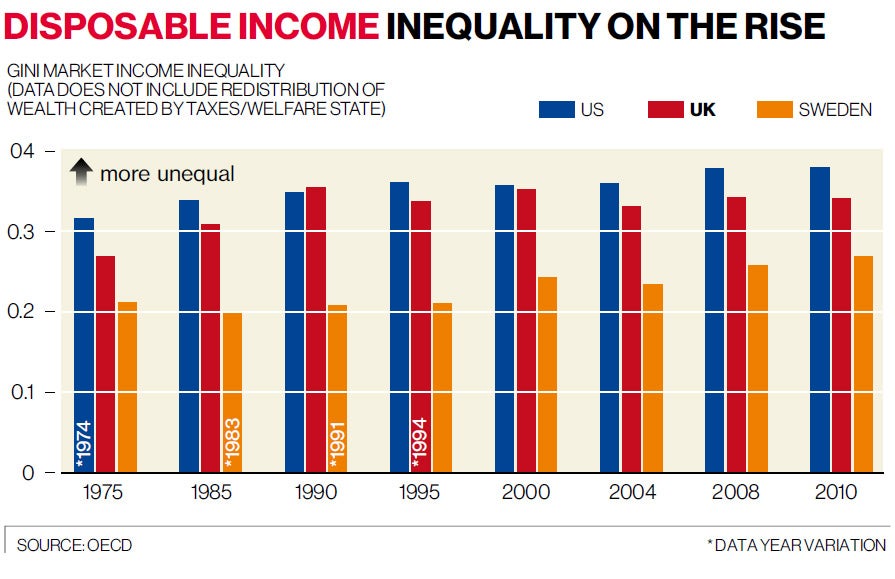
Click graphic to enlarge
Income inequality increased by more in the first three years of the crisis (2008-2010) than in the previous 12 years, before factoring in the effect of taxes and benefits, according to new data from the Organisation for European Economic Co-operation (OECD). The study of 34 developed nations, including the UK, concludes that the “pain of the crisis was not evenly shared”.
Young adults were most affected by the economic downturn in Britain, with an additional 4 per cent of 18-25-year-olds going into poverty between 2007 and 2010. Rates of poverty for children and the elderly were stagnant during the same period.
Michael Forster, senior analyst at OECD, said: “The welfare state has cushioned the blow for many but more social spending cuts in OECD countries, including the United Kingdom, may increase the risk of greater inequality and poverty in the years ahead. We can show that between 2007 and 2010 in most countries, including Britain, the welfare state was working: that’s the good news. The bad news is that if you reduce the welfare system too much there might be a danger for poorer population groups.”
Mr Forster added: “The first few years of the crisis were the easier ones, because the welfare system cushioned the effects. But now these welfare systems are under challenge. As the crisis lingers on there’s no sustainable growth and it’s very important to design reforms that do not put pressure on poorer people.”
Britain’s “market income inequality”, which excludes any redistribution of wealth created by taxes and the welfare state, reached a high of 0.523 on the gini scale in 2010 (the gini scale measures zero as the most equal society and one as the least). This indicates that Britain had become much less equal since 2007, when the rating was 0.504. and 1995, when it measured 0.507. Danny Dorling, professor of human geography at the University of Sheffield, backed the OECD’s warning that inequality is likely to rise. “The majority of the impacts of the recession have still not been felt by most people who we know are going to be most badly affected because the majority of the cuts have just begun to occur. The effect of benefits going down in real terms, for example, has yet to come,” he said.
Britain had the seventh largest gap between its richest and poorest out of all 34 OECD countries. It emerged last week that London is home to more multi-millionaires than any other city in the world, with 4,224 in the capital.
After taxes and transfers, the richest 10 per cent of the population in OECD countries earned 9.5 times the income of the poorest 10 per cent in 2010, up from 9 times in 2007. Poorer households tended to lose more or gain less than richer households between 2007 and 2010. The top 10 per cent of the population did better than the poorest 10 per cent in 21 of the 33 countries where data was available.
A Department for Work and Pensions spokesman said: “Despite paying out £170bn in tax credits alone, the previous government failed to meet their target to halve child poverty by 2010 and far too many children were left behind. That is why we want to take a new approach by tackling the root causes of poverty, including worklessness, educational failure and family breakdown. Our welfare reforms will improve the lives of some of the poorest families in our communities.”
The UK fell from fifth to 12th place between 2005 and 2011 in a table of household incomes for 30 states belonging to the OECD, the Office for National Statistics (ONS) said yesterday. Its decline was partly attributed to the drop in the value of the pound, meaning that while income has grown, this spending power did not stretch as far when compared to other countries.
Join our commenting forum
Join thought-provoking conversations, follow other Independent readers and see their replies
Comments