Budget spending cuts: This chart shows the worst is still to come
'Sharp acceleration' in cuts will be followed by a spending spree in 2019/20 in 'rollercoaster' for public purse
Sign up for the View from Westminster email for expert analysis straight to your inbox
Get our free View from Westminster email
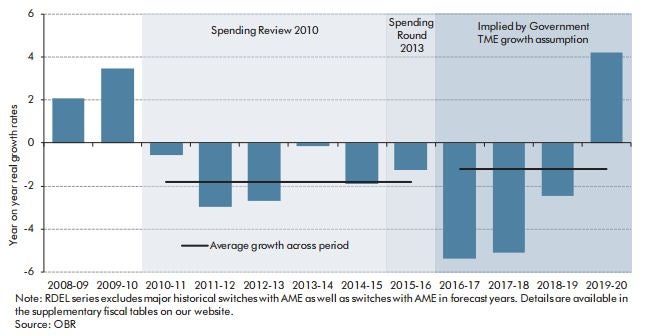
The enormous scale of cuts still to come is laid bare by this graph produced by the official spending watchdog, which predicted a “rollercoaster” journey ahead for the public purse.
Analysis of George Osborne’s Budget by the Office for Budget Responsibility shows the biggest cuts are still to come but this will be followed by a spending spree at the end of the decade.
It predicted a “sharp acceleration” in public spending cuts between 2016 and 2018 on a much larger scale than we have experienced since 2010.
The OBR forecast says: “This leaves a rollercoaster profile for implied public services spending through the next Parliament: a much sharper squeeze on real spending in 2016-17 and 2017-18 than anything seen over the past five years followed by the biggest increase in real spending for a decade in 2019-20.”
Tory officials said the splurge in spending predicted at the end of the decade had not taken account of their party’s proposed £12bn of welfare cuts.
Budget 2015: George Osborne unveils pre-election package
Show all 7Subscribe to Independent Premium to bookmark this article
Want to bookmark your favourite articles and stories to read or reference later? Start your Independent Premium subscription today.
Join our commenting forum
Join thought-provoking conversations, follow other Independent readers and see their replies