Census reveals biggest surge in population since records began
Unexpected rise in numbers in England and Wales to 53 million, lastest figures show

Your support helps us to tell the story
From reproductive rights to climate change to Big Tech, The Independent is on the ground when the story is developing. Whether it's investigating the financials of Elon Musk's pro-Trump PAC or producing our latest documentary, 'The A Word', which shines a light on the American women fighting for reproductive rights, we know how important it is to parse out the facts from the messaging.
At such a critical moment in US history, we need reporters on the ground. Your donation allows us to keep sending journalists to speak to both sides of the story.
The Independent is trusted by Americans across the entire political spectrum. And unlike many other quality news outlets, we choose not to lock Americans out of our reporting and analysis with paywalls. We believe quality journalism should be available to everyone, paid for by those who can afford it.
Your support makes all the difference.A baby boom, longer life expectancy and new migrant settlers over the past decade have led to the single-largest surge in the population since records began.
England and Wales is home to 3.7 million more people than a decade ago, according to the 2011 census figures released today, bringing the total population to 53.1million. Just over half the increase was down to new settlers– the second decade in a row that net migration has substantially contributed to population growth.
The rise is almost half a million larger than predicted at the last census, explained by better counting and more migrants than previously thought, according to the Office of National Statistics (ONS). It compares with an increase of 1.6million people in the previous decade.
The new people, young and old, are by no means evenly spread across the two countries, with over half of the population growth concentrated in London, the South East and the East of England.
In fact, with some notable exceptions such as Greater Manchester, many towns and cities in the north saw populations decrease or stagnate.
The regional variation means the average population density of 371 people living in every square kilometre is misleading as the capital wildly skews the figure.
In London, there are a staggering 5,200 people per kilometre squared, tussling it out for limited housing, desirable schools, cycle lanes and space on the tube. By excluding London, the national average drops to 321.
The census figures, taken on 27 March 2011, prompted a mixed response, ranging from doom and gloom about bursting Britain to optimism about the country’s ability to cope, adapt and take advantage of the growing, and increasingly diverse population amid shrinking natural and financial resources.
Matt Cavanagh, visiting fellow at the Institute of Public Policy, said: “It is really only London and the South East which is crowded, rather than our island as a whole. Today’s figures show that some local authorities, particularly in the north, are struggling with the opposite problem.
He added: “Planning for infrastructure, housing, and services, and more fundamentally, our attitude to urbanization, resource scarcity, emissions and other related questions, [are relevant issues] even in the hypothetical scenario of zero net immigration.”
Simon Ross, chief executive of Population Matters, said: "England faces unsustainable pressure on housing, roads and public transport and green spaces... we should give an example to other countries by seeking to limit our numbers."
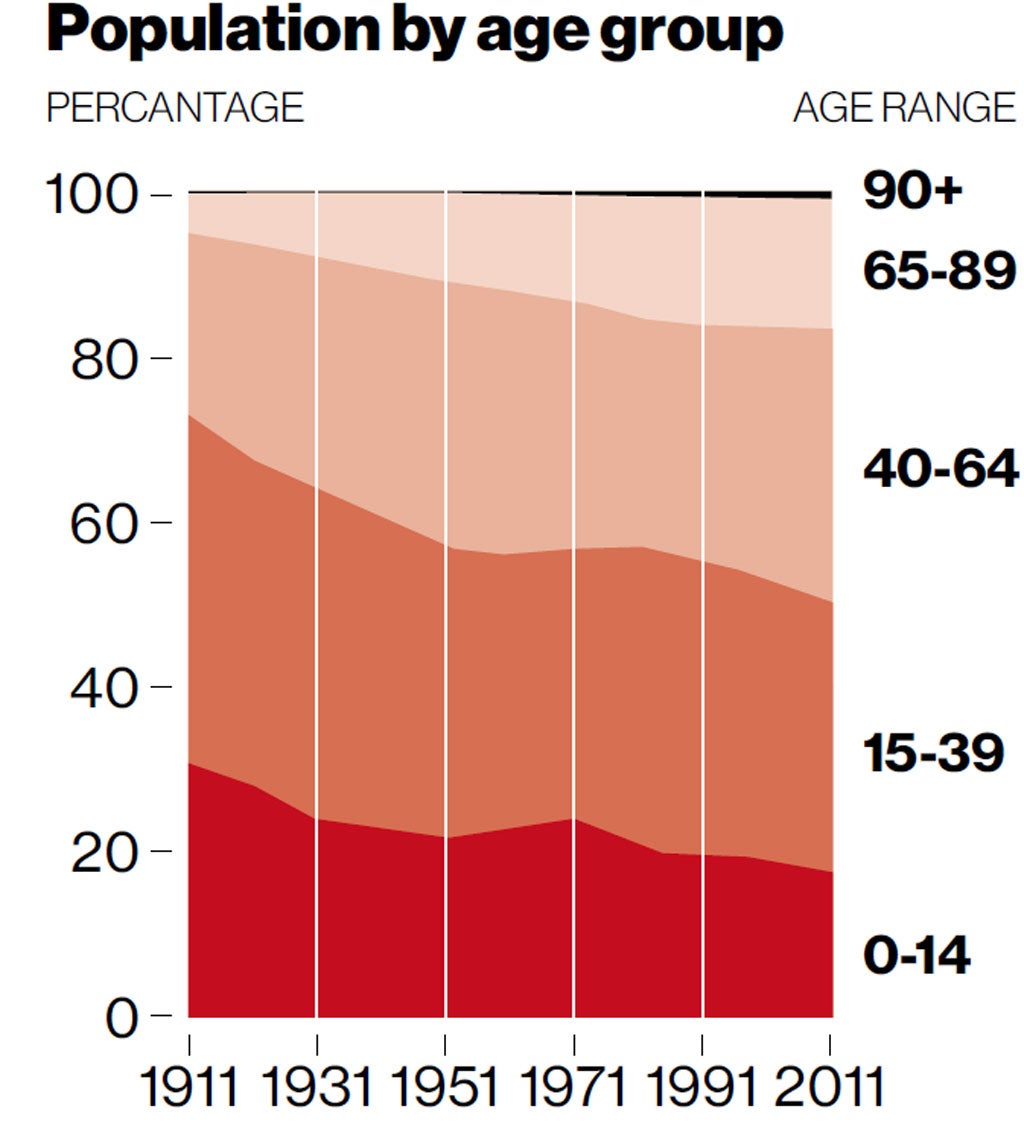
The biggest increases were among the very old and very young.
There were 3.5million pre-school children in 2011 – 406,000 more than 10 years earlier – with a 12 per cent rise in this group in the West Midlands. The birth rate is higher among new migrants because they are usually of working age, but is also rising among British born women from different ethnic backgrounds.
For the first time ever, one in six Britons is now over 65. The biggest rise was among the over 90s reflecting the increased longevity most individuals covet, and most public policy makers fear due to demand for health and social care services.
Again, regional variations were apparent as in 11 local authorities more than a quarter of the population are aged 65 or over, with the highest being Christchurch in Dorset with 30 per cent.
This age distribution has huge implications for the provision of public services such as hospitals, social care and schools, but also for the amount of tax revenue councils can expect to earn and how much they receive from Whitehall.
A debate is raging about the accuracy of the data, for example Westminster council today accused the ONS of “under counting” and so depriving it of rightful government funds, and this could be the last ever national census.
In terms of baseline numbers, the biggest implication of the 7 per cent increase was for housing, according to Professor Jane Falkingham, director of the Centre for Population Change at Southampton University. “But the changing age structure has biggest implications for health and education.”
She added: “In general the migrant numbers just mean we are becoming a more diverse and dynamic culture, with people bringing their skills to the UK. But there are some local areas which have seen dramatic transformations of their ethnic mix and the further breakdown of data we get from the ONS later this year will help local authorities to see whether they are providing the right services for their population.”
Join our commenting forum
Join thought-provoking conversations, follow other Independent readers and see their replies
Comments