Your support helps us to tell the story
From reproductive rights to climate change to Big Tech, The Independent is on the ground when the story is developing. Whether it's investigating the financials of Elon Musk's pro-Trump PAC or producing our latest documentary, 'The A Word', which shines a light on the American women fighting for reproductive rights, we know how important it is to parse out the facts from the messaging.
At such a critical moment in US history, we need reporters on the ground. Your donation allows us to keep sending journalists to speak to both sides of the story.
The Independent is trusted by Americans across the entire political spectrum. And unlike many other quality news outlets, we choose not to lock Americans out of our reporting and analysis with paywalls. We believe quality journalism should be available to everyone, paid for by those who can afford it.
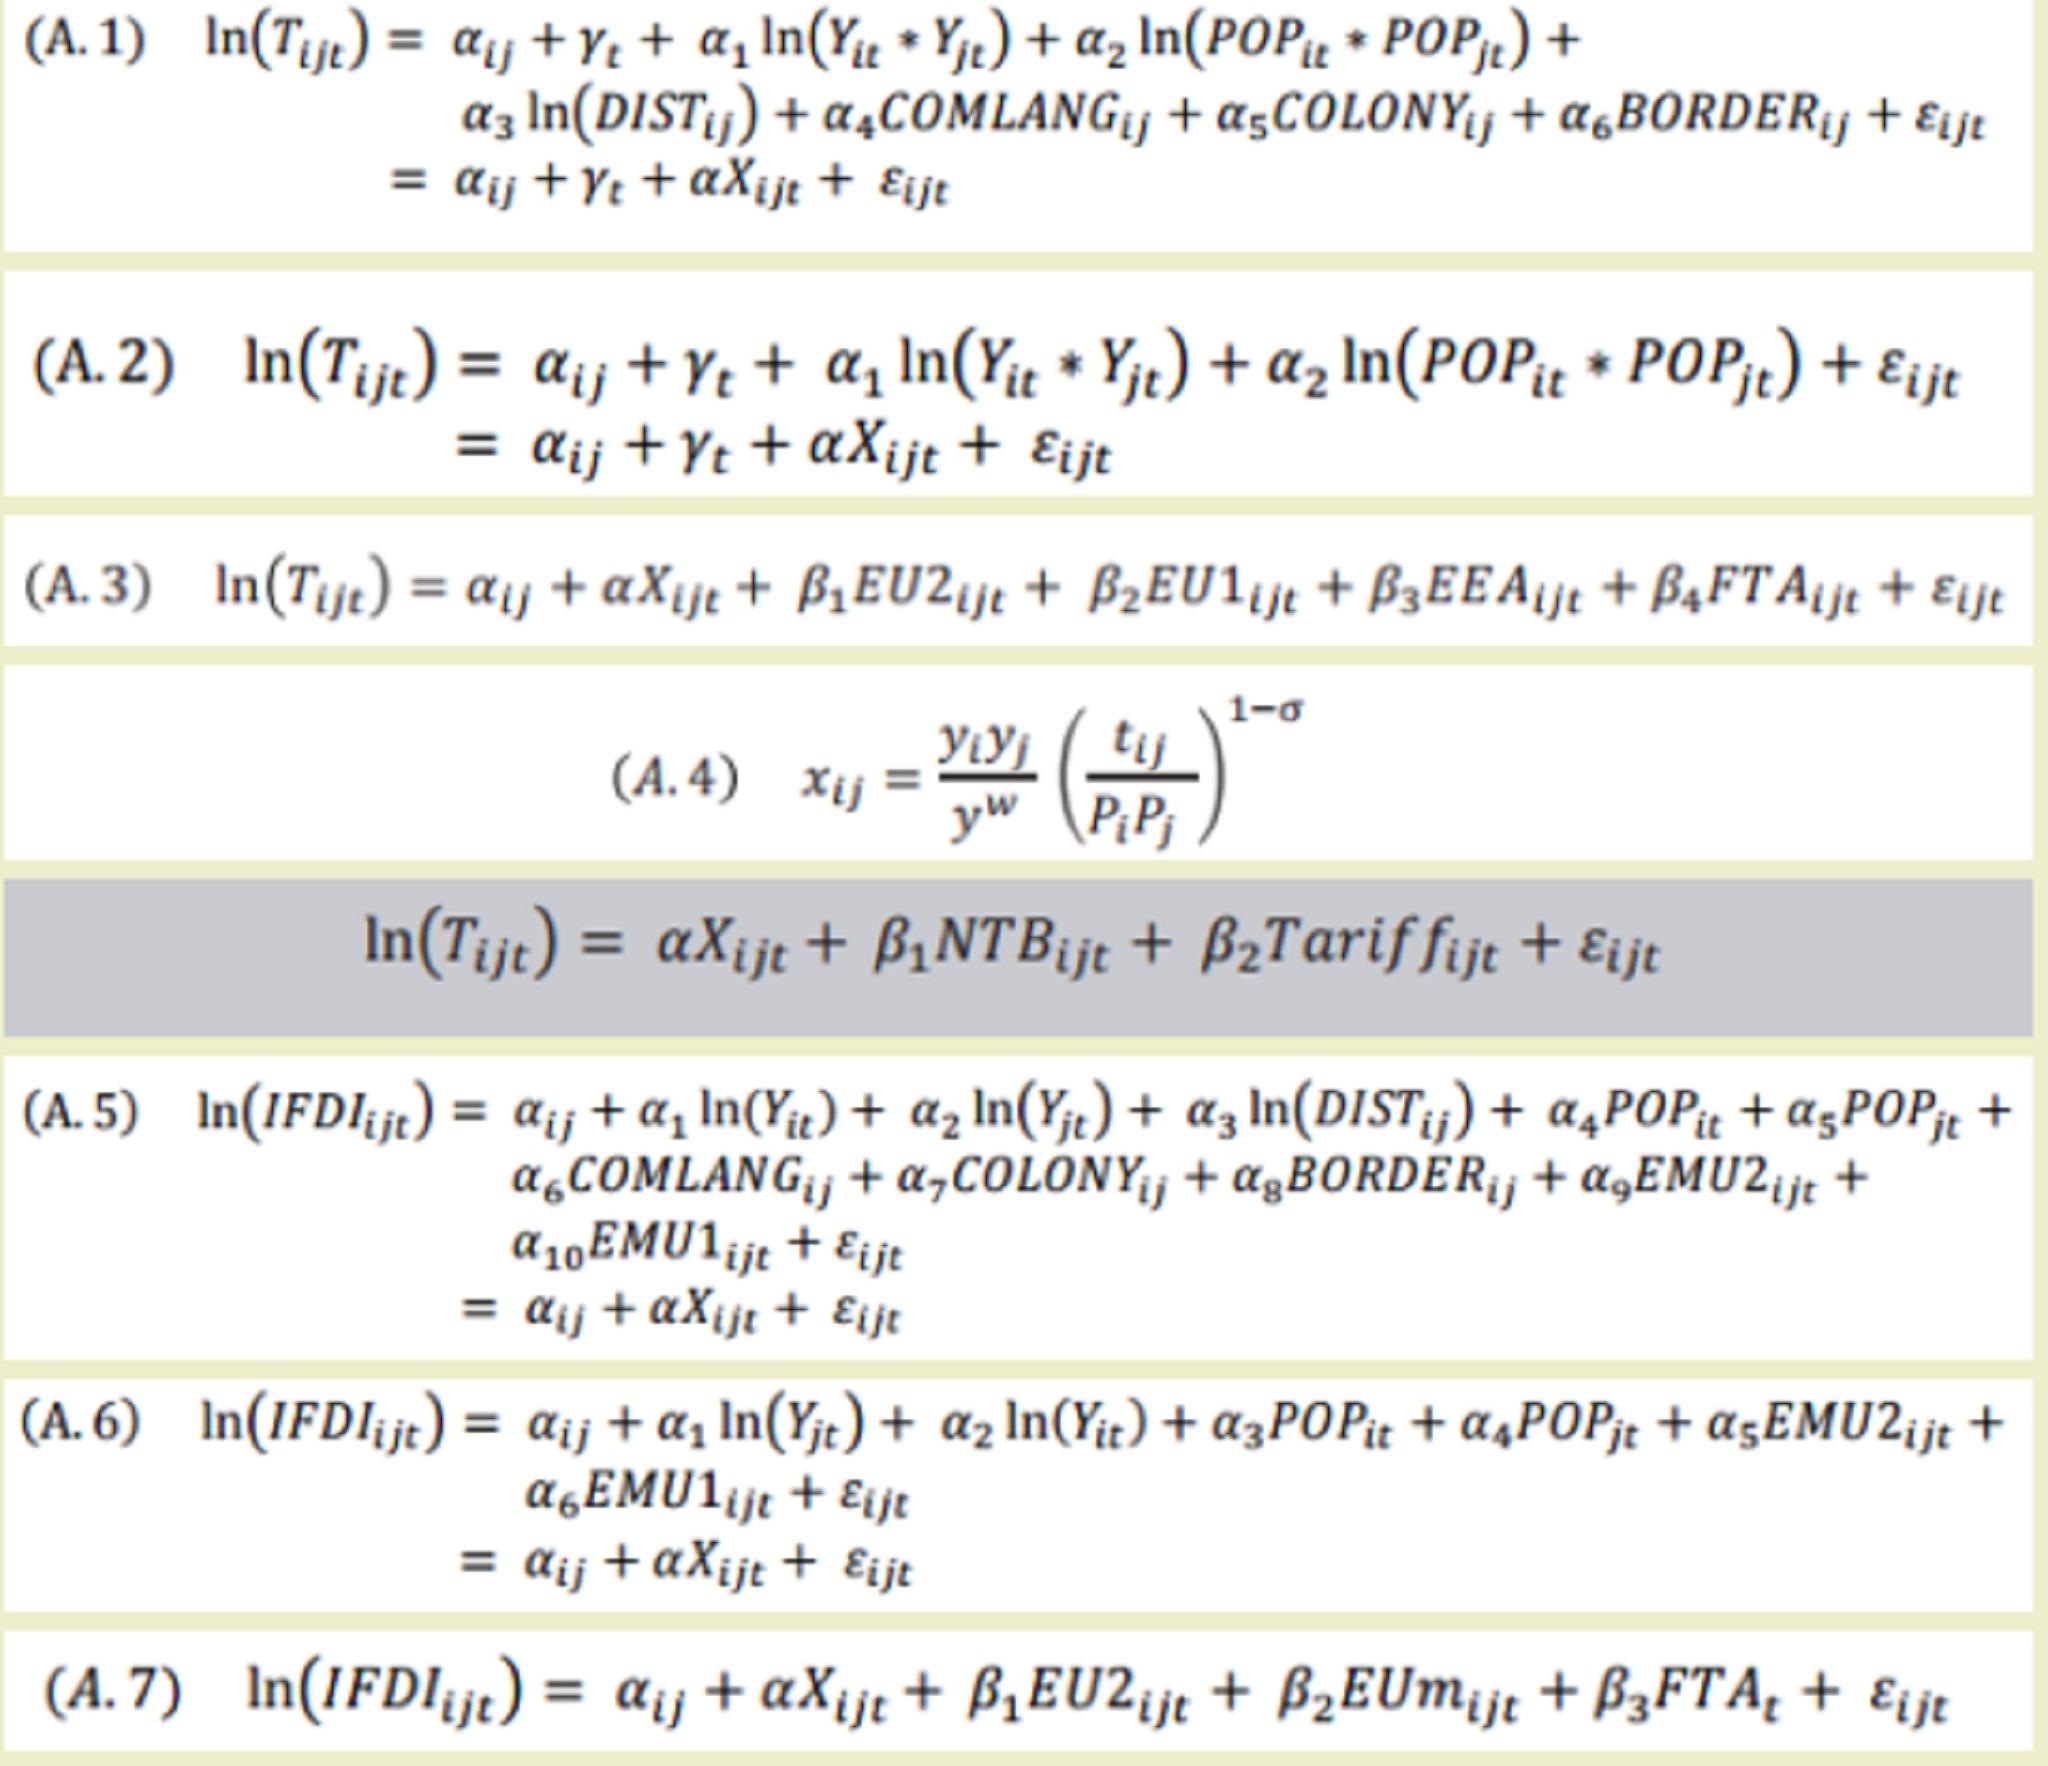
Your support makes all the difference.This looks stupidly complicated. What does this mean?
These are the equations at the heart of the Treasury’s economic model, which is designed to quantify the impact of Britain leaving the European Union. It’s this model that has been cited by George Osborne as showing the economy could be 6 per cent smaller in 2030 relative to staying in the EU, meaning each household would be £4,300 worse off.
So what do all those letters mean?
They are inputs to the model, assumptions plugged into the equation. The capital T denotes trade flows. The capital Ys are the two GDPs of two trading countries. POP is population. DIST is distance. COMLANG denotes common language. BORDER means the trading countries share a common border. COLONY signifies when the country is a former colony. NTB means non-tarrif barriers. IFDI means internal foreign direct investment. FTA means free trade agreement. These are the various conditions that the Treasury’s team believe have a big impact on a country’s economic performance.
How do they know that?
It’s based on an analysis of historic data. For instance, they see that countries with a common border tend to do more trade. Ditto for countries that are closer together. They see that countries that do more trade seem to have higher productivity growth and to adopt new technologies faster. What the model tries to capture is the likely impact of Brexit on various factors that have historically been important for UK GDP growth, all based on historic relationships between variables.
And what are those variables?
First of all trade volumes. Then there is foreign direct investment (FDI) into the UK. Finally there is productivity growth (the amount of output the UK producers per worker).
What do other modellers say about the Treasury’s assumptions?
In its central scenario, the Treasury assumes the UK would negotiate a Canadian-style bilateral trade agreement with the EU. And this leads to an estimated fall in UK trade volumes of between 14 and 19 per cent as a result of various new tariffs that would follow. But the Oxford Economics model for a roughly similar post-Brexit trade agreement scenario only produced a fall in trade volumes of 7 per cent. “There’s twice as much trade destruction [in the Treasury’s trade forecast]… To us they feel a little strong” said Henry Worthington of Oxford Economics.
Is that the only discrepancy?
The other big difference between the Oxford Economics report and the Treasury’s lies in the assumptions of the Treasury on the knock-on impact of the fall in trade on the UK’s productivity growth. The Treasury has looked at previous studies of how, historically, changes in UK trade volumes impact domestic UK productivity growth. And from these studies it has calculated an “elasticity” that it has fed into its model equation. Oxford Economics used elasticities that were only half as large as the Treasury's. This means for a given fall in trade, the fall in productivity growth is less than half as large in Oxford’s model. But Mr Worthington said the Treasury’s assumptions on this were not unreasonable. “We wouldn’t suggest that they’ve been deliberately mis-chosen” he said. But he stressed that Oxford had used its own econometric model to produce its trade/productivity growth elasticities, rather than previous academic studies as the Treasury had.
What's the result?
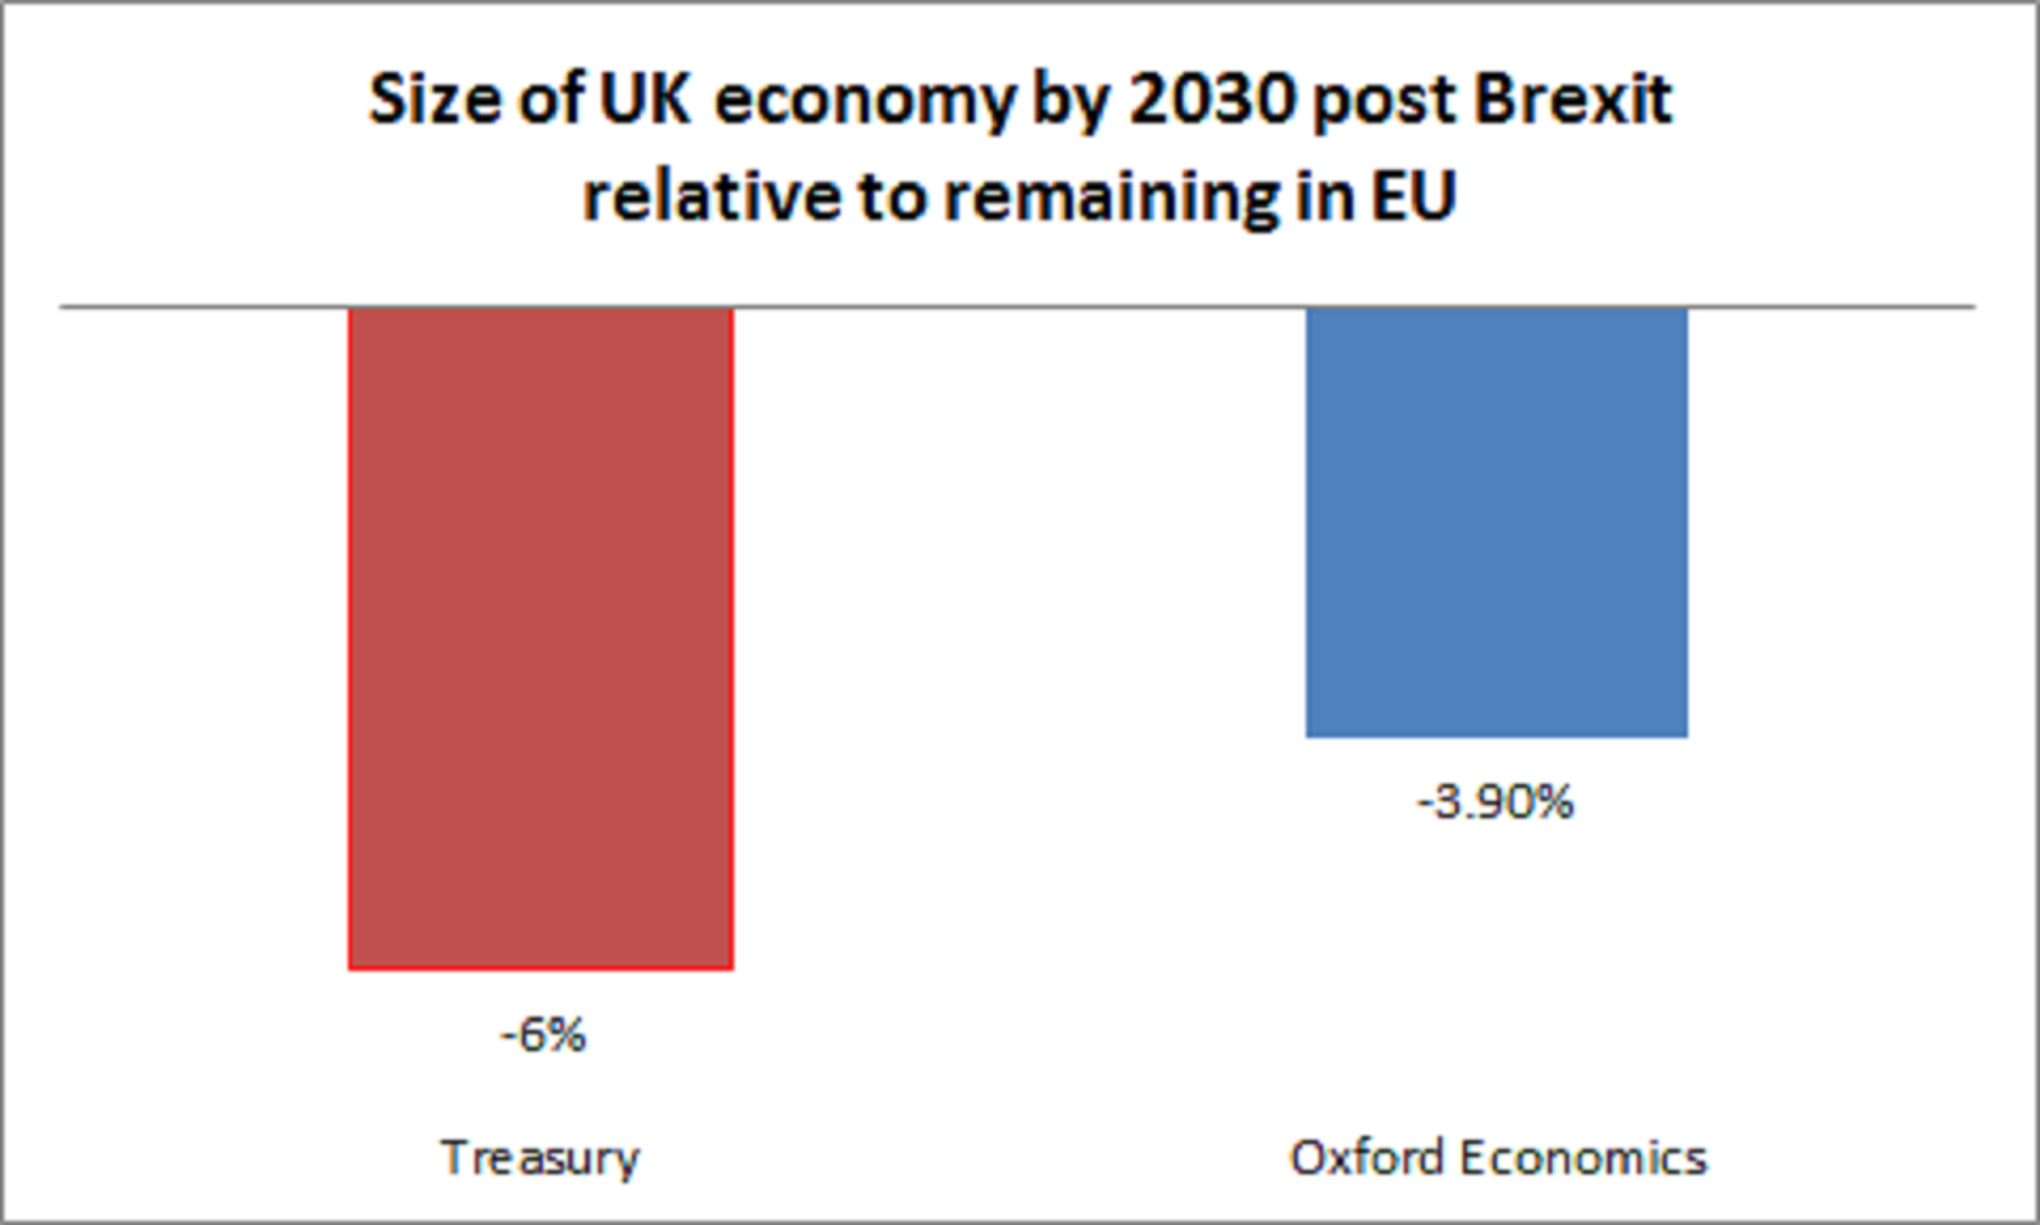
The negative impact on trade of Brexit in the Treasury's model is twice as high as in that of Oxford Economics. The negative impact on productivity growth of that fall in trade is also twice as strong. That difference largely explains why the Treasury sees the ultimate GDP shortfall by 2030 as almost twice as big:


Join our commenting forum
Join thought-provoking conversations, follow other Independent readers and see their replies
Comments