Your support helps us to tell the story
From reproductive rights to climate change to Big Tech, The Independent is on the ground when the story is developing. Whether it's investigating the financials of Elon Musk's pro-Trump PAC or producing our latest documentary, 'The A Word', which shines a light on the American women fighting for reproductive rights, we know how important it is to parse out the facts from the messaging.
At such a critical moment in US history, we need reporters on the ground. Your donation allows us to keep sending journalists to speak to both sides of the story.
The Independent is trusted by Americans across the entire political spectrum. And unlike many other quality news outlets, we choose not to lock Americans out of our reporting and analysis with paywalls. We believe quality journalism should be available to everyone, paid for by those who can afford it.
Your support makes all the difference.Good news: prices are no longer falling in the eurozone.
But don’t break out the champagne.
According to the European number crunchers Eurostat consumer prices across the 19 nation bloc were flat on a year earlier in March. The inflation rate was zero.
This means the eurozone remains very much within the deflationary danger zone.
The European Central Bank has been trying to break the grip of deflation – which can be lethal for economic growth - on the bloc for more than a year now.
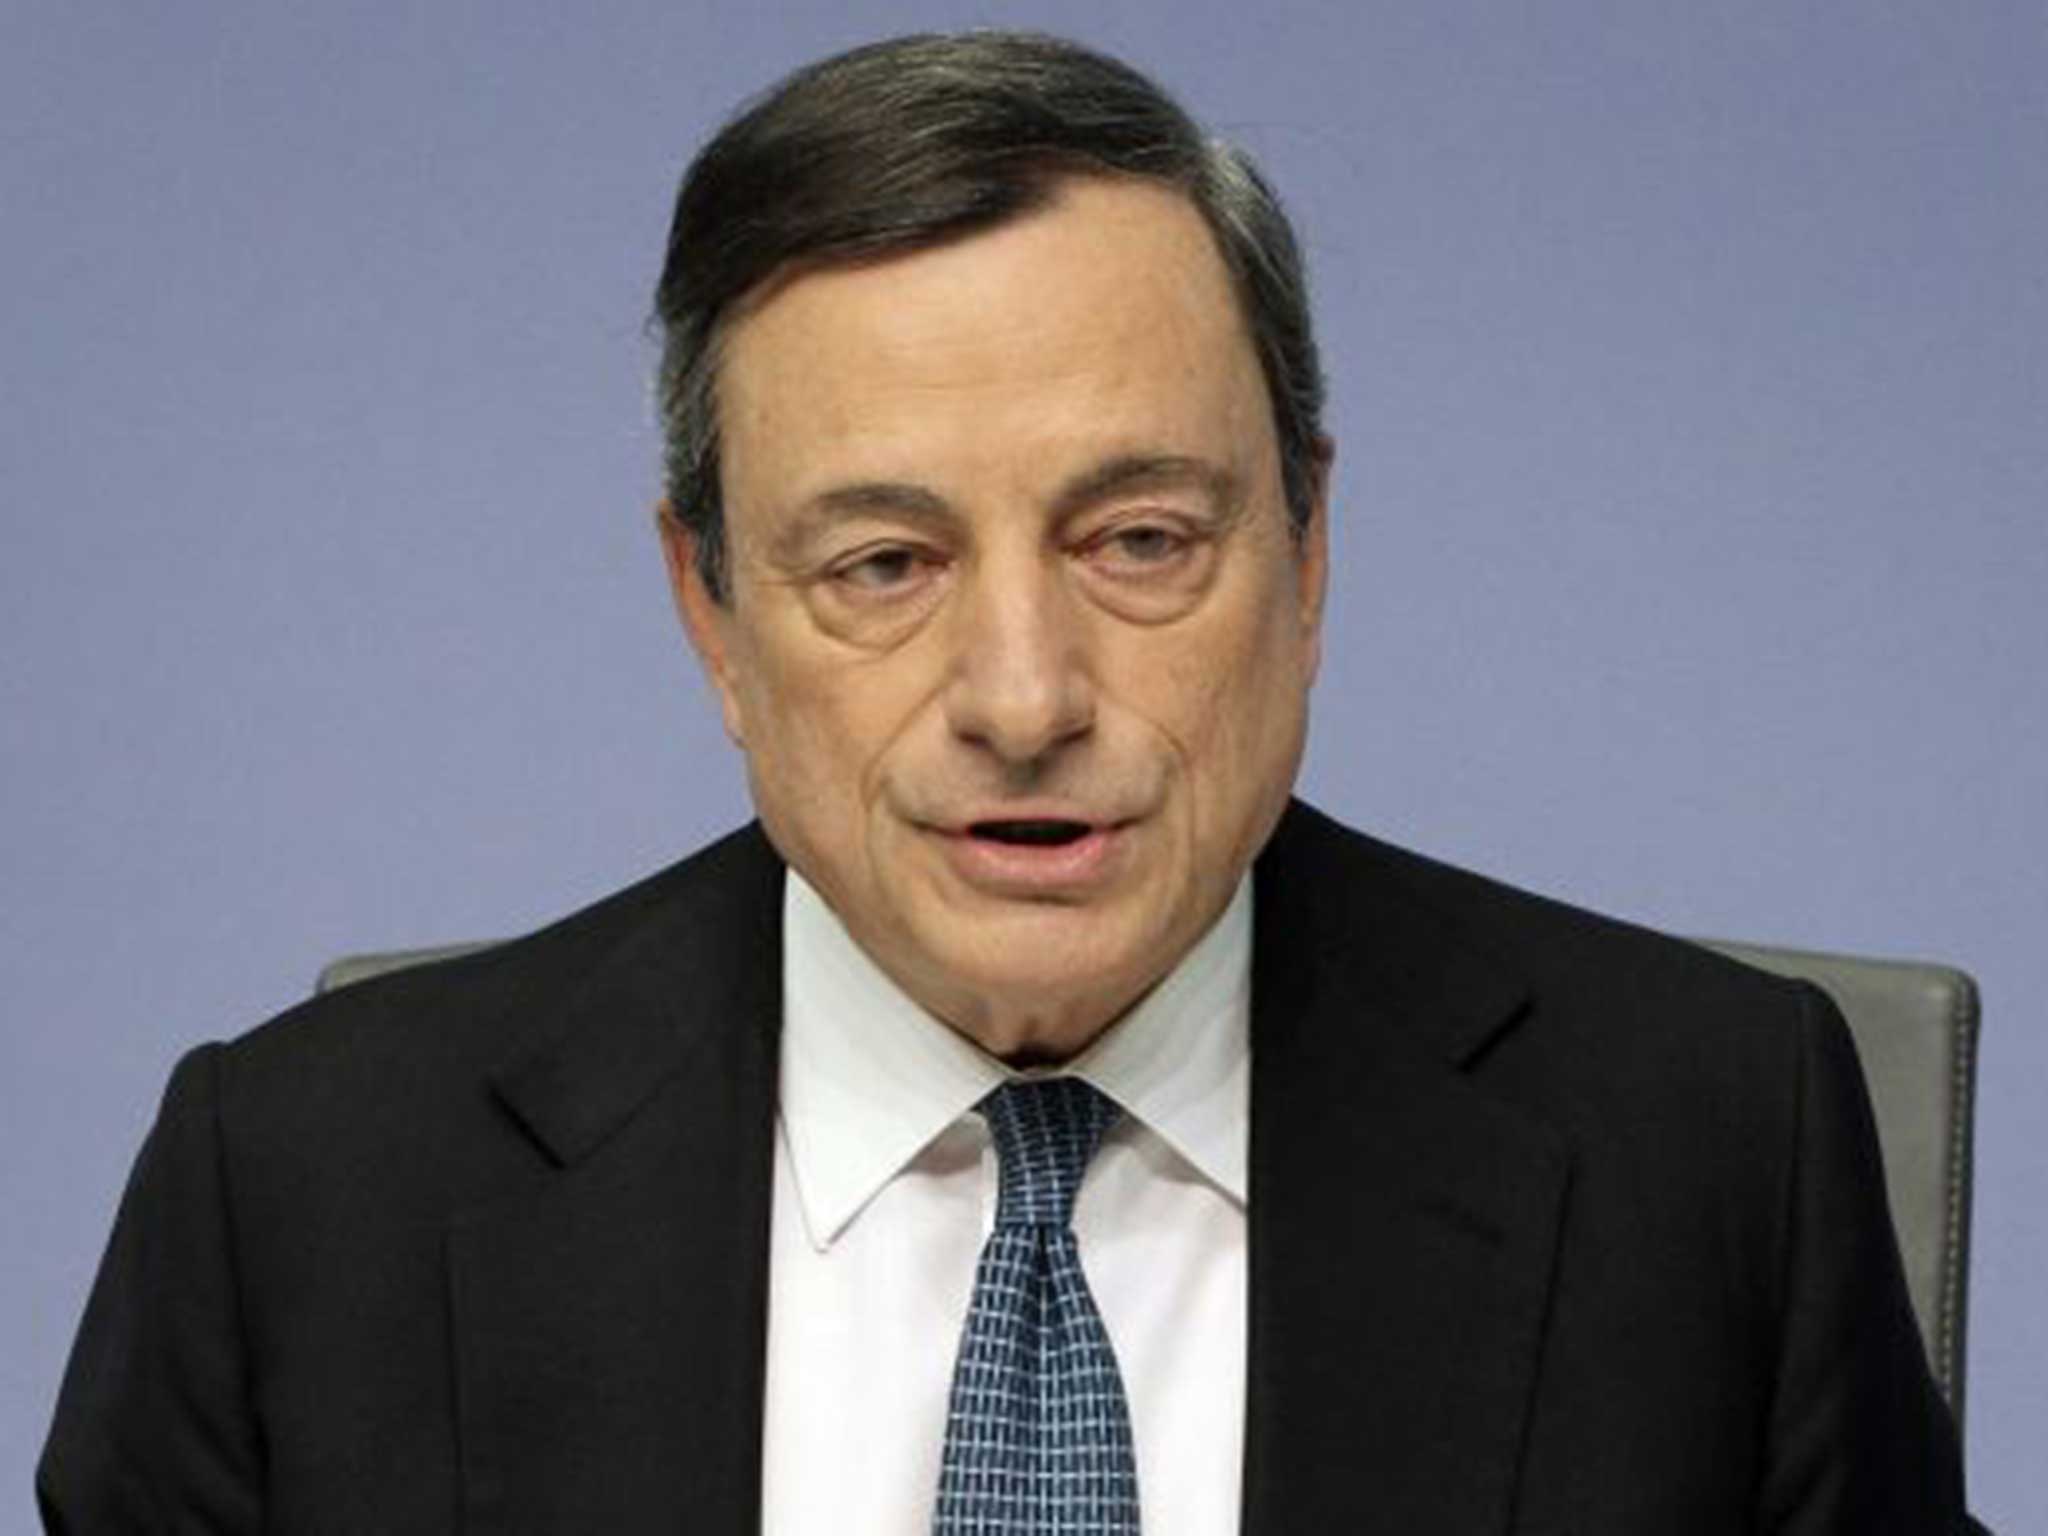
To this end the ECB’s president Mario Draghi announced a major programme to buy up eurozone government bonds and company debt in January 2015. The central bank has been buying €60bn of these assets a month in the hope that that flood of money entering the continent’s financial system would lift inflation into positive territory.
The trouble is, as the chart below shows, is that all that money printing doesn’t seem to be working in pushing up prices:
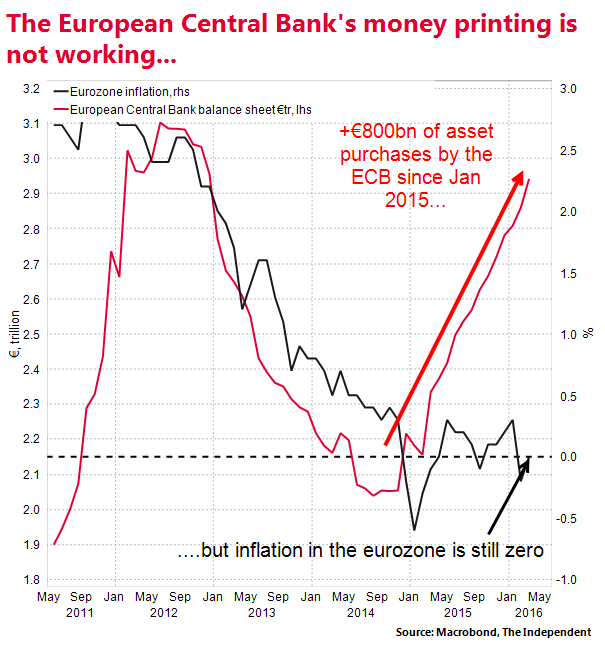
But the ECB is not giving up. In December it announced that it would continue its programme until March 2017 “or beyond”. The programme was originally supposed to end in September 2016. And in March it upped the size of the monthly bond purchases to €80bn.
In other words, the ECB will continue printing money until inflation rises to the central bank’s target of (just below) 2 per cent a year.
Join our commenting forum
Join thought-provoking conversations, follow other Independent readers and see their replies
Comments