Earth Day 2016: 5 charts that show how we are killing our planet
Scientists have warned of 'dramatic and irreversible environmental changes'
Your support helps us to tell the story
From reproductive rights to climate change to Big Tech, The Independent is on the ground when the story is developing. Whether it's investigating the financials of Elon Musk's pro-Trump PAC or producing our latest documentary, 'The A Word', which shines a light on the American women fighting for reproductive rights, we know how important it is to parse out the facts from the messaging.
At such a critical moment in US history, we need reporters on the ground. Your donation allows us to keep sending journalists to speak to both sides of the story.
The Independent is trusted by Americans across the entire political spectrum. And unlike many other quality news outlets, we choose not to lock Americans out of our reporting and analysis with paywalls. We believe quality journalism should be available to everyone, paid for by those who can afford it.
Your support makes all the difference.Earth Day, celebrated on 22 April, is the world's biggest moment to reflect on the damage that is being done to our planet, and how humanity can help. And these charts show that there is much for people to do.
The designated day, which the UN hopes can help save the environment and the people that rely on it, is intended to help change people's behaviour so that they can work to protect the planet.
As these charts show, that mission has never been more vital. But it has also never been more difficult.
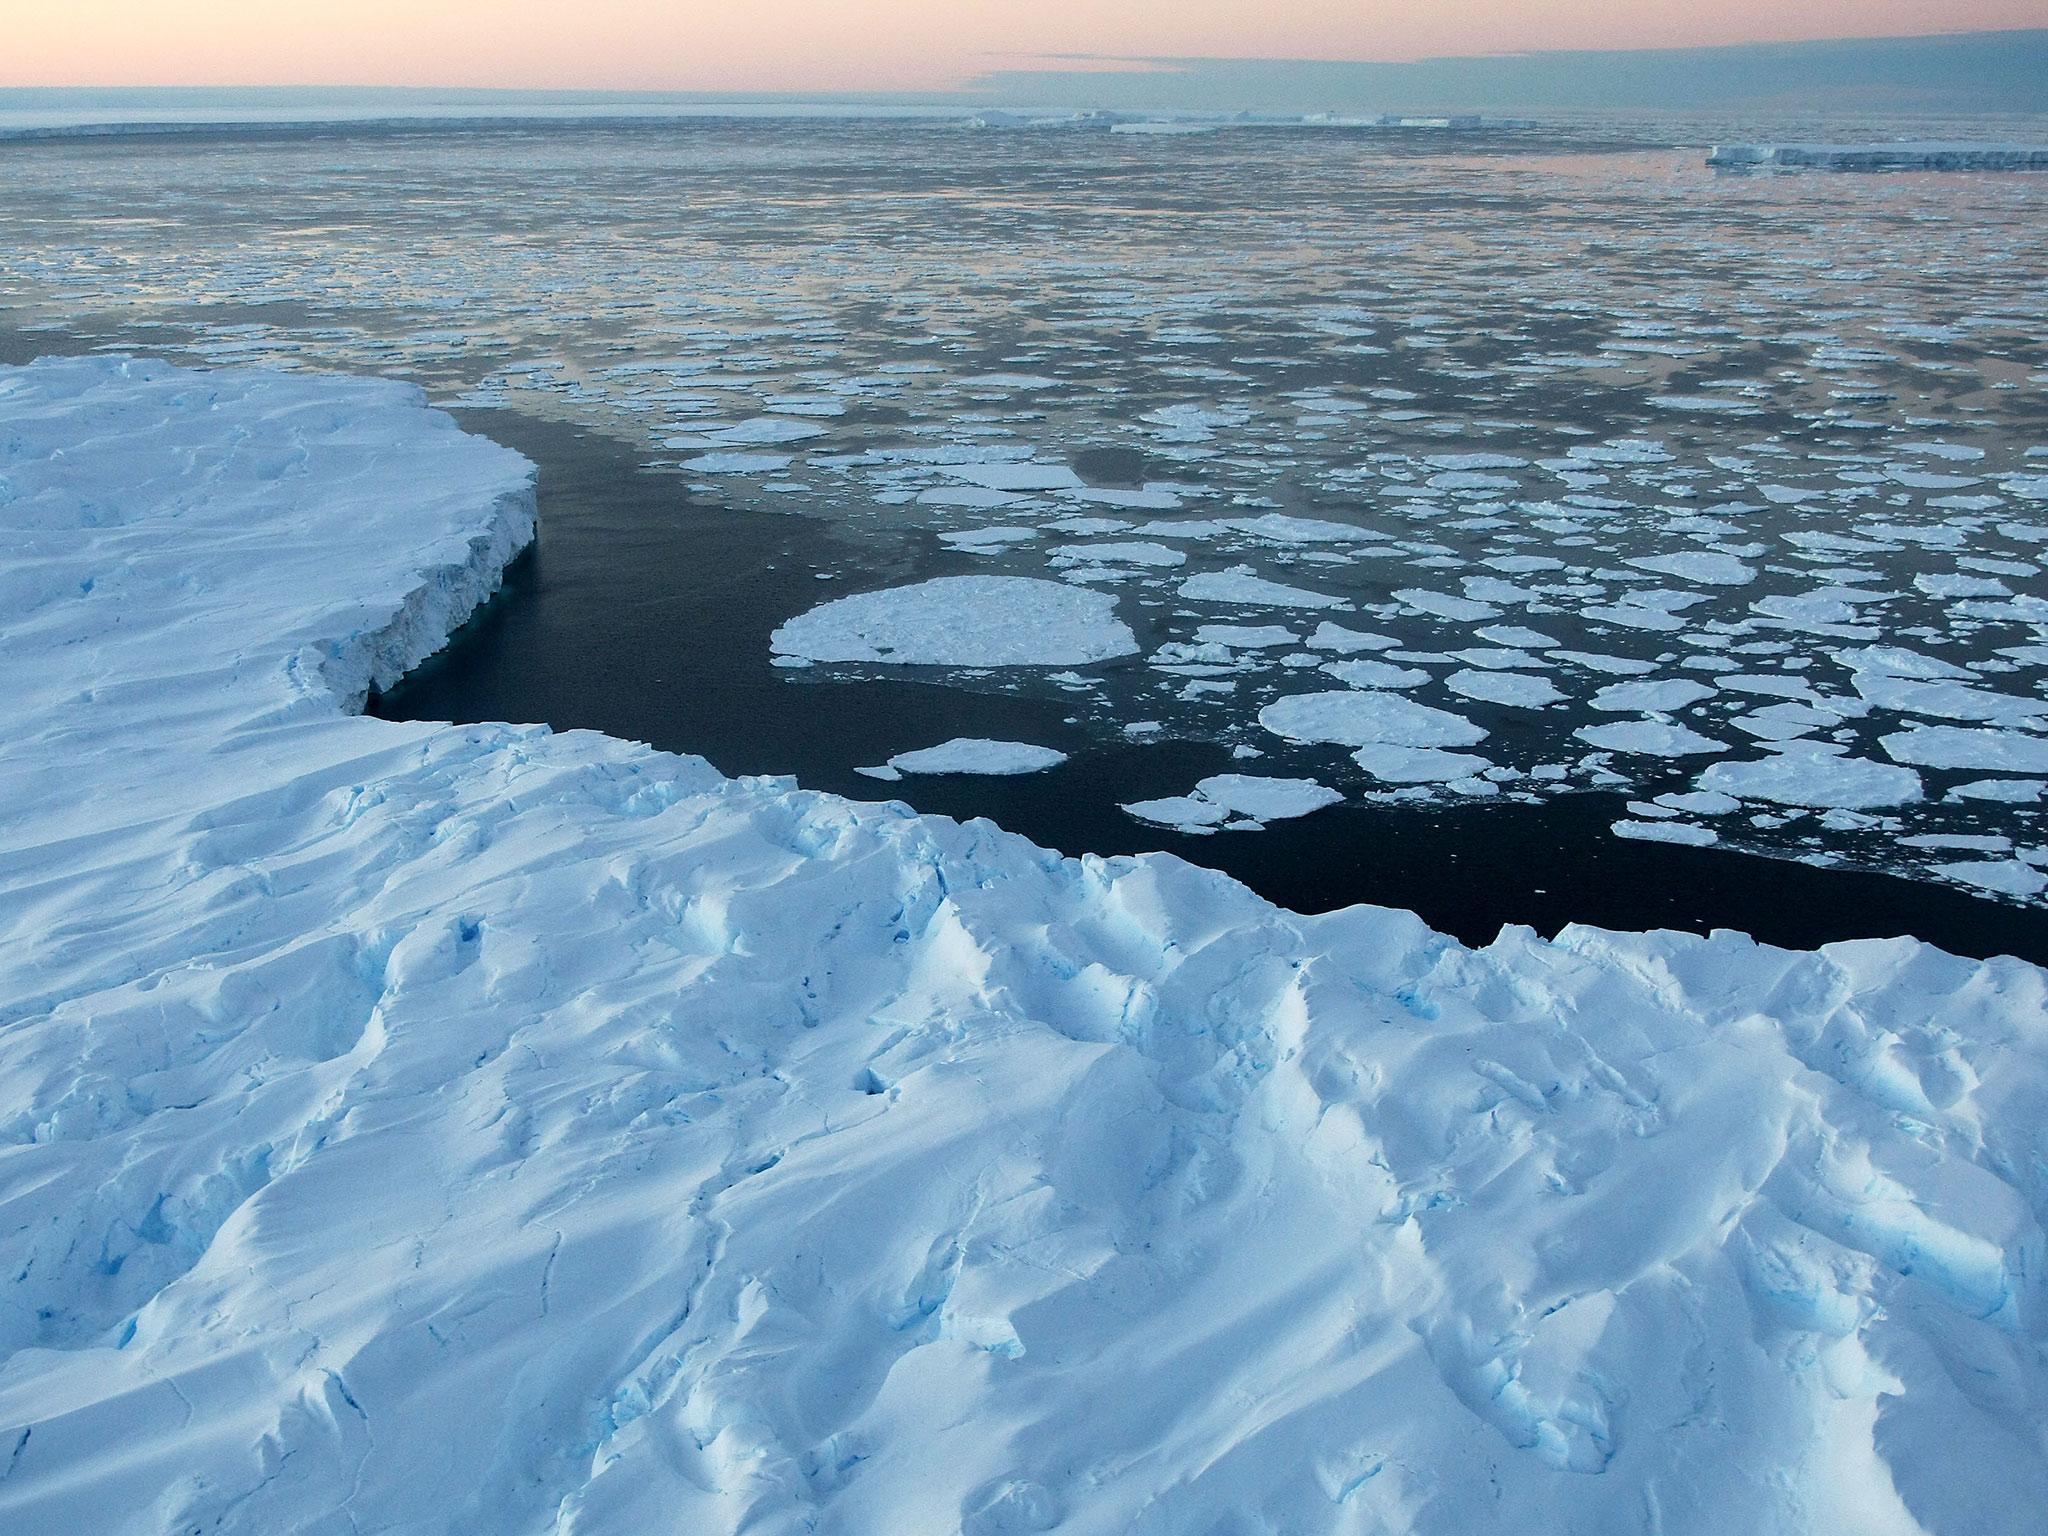
The rise in global temperatures is causing the ice to melt. This affects sea levels and the habitats for animals who live in the Arctic. Animals such as polar bears whose habitat revolves around the ice are also affect by the changes.
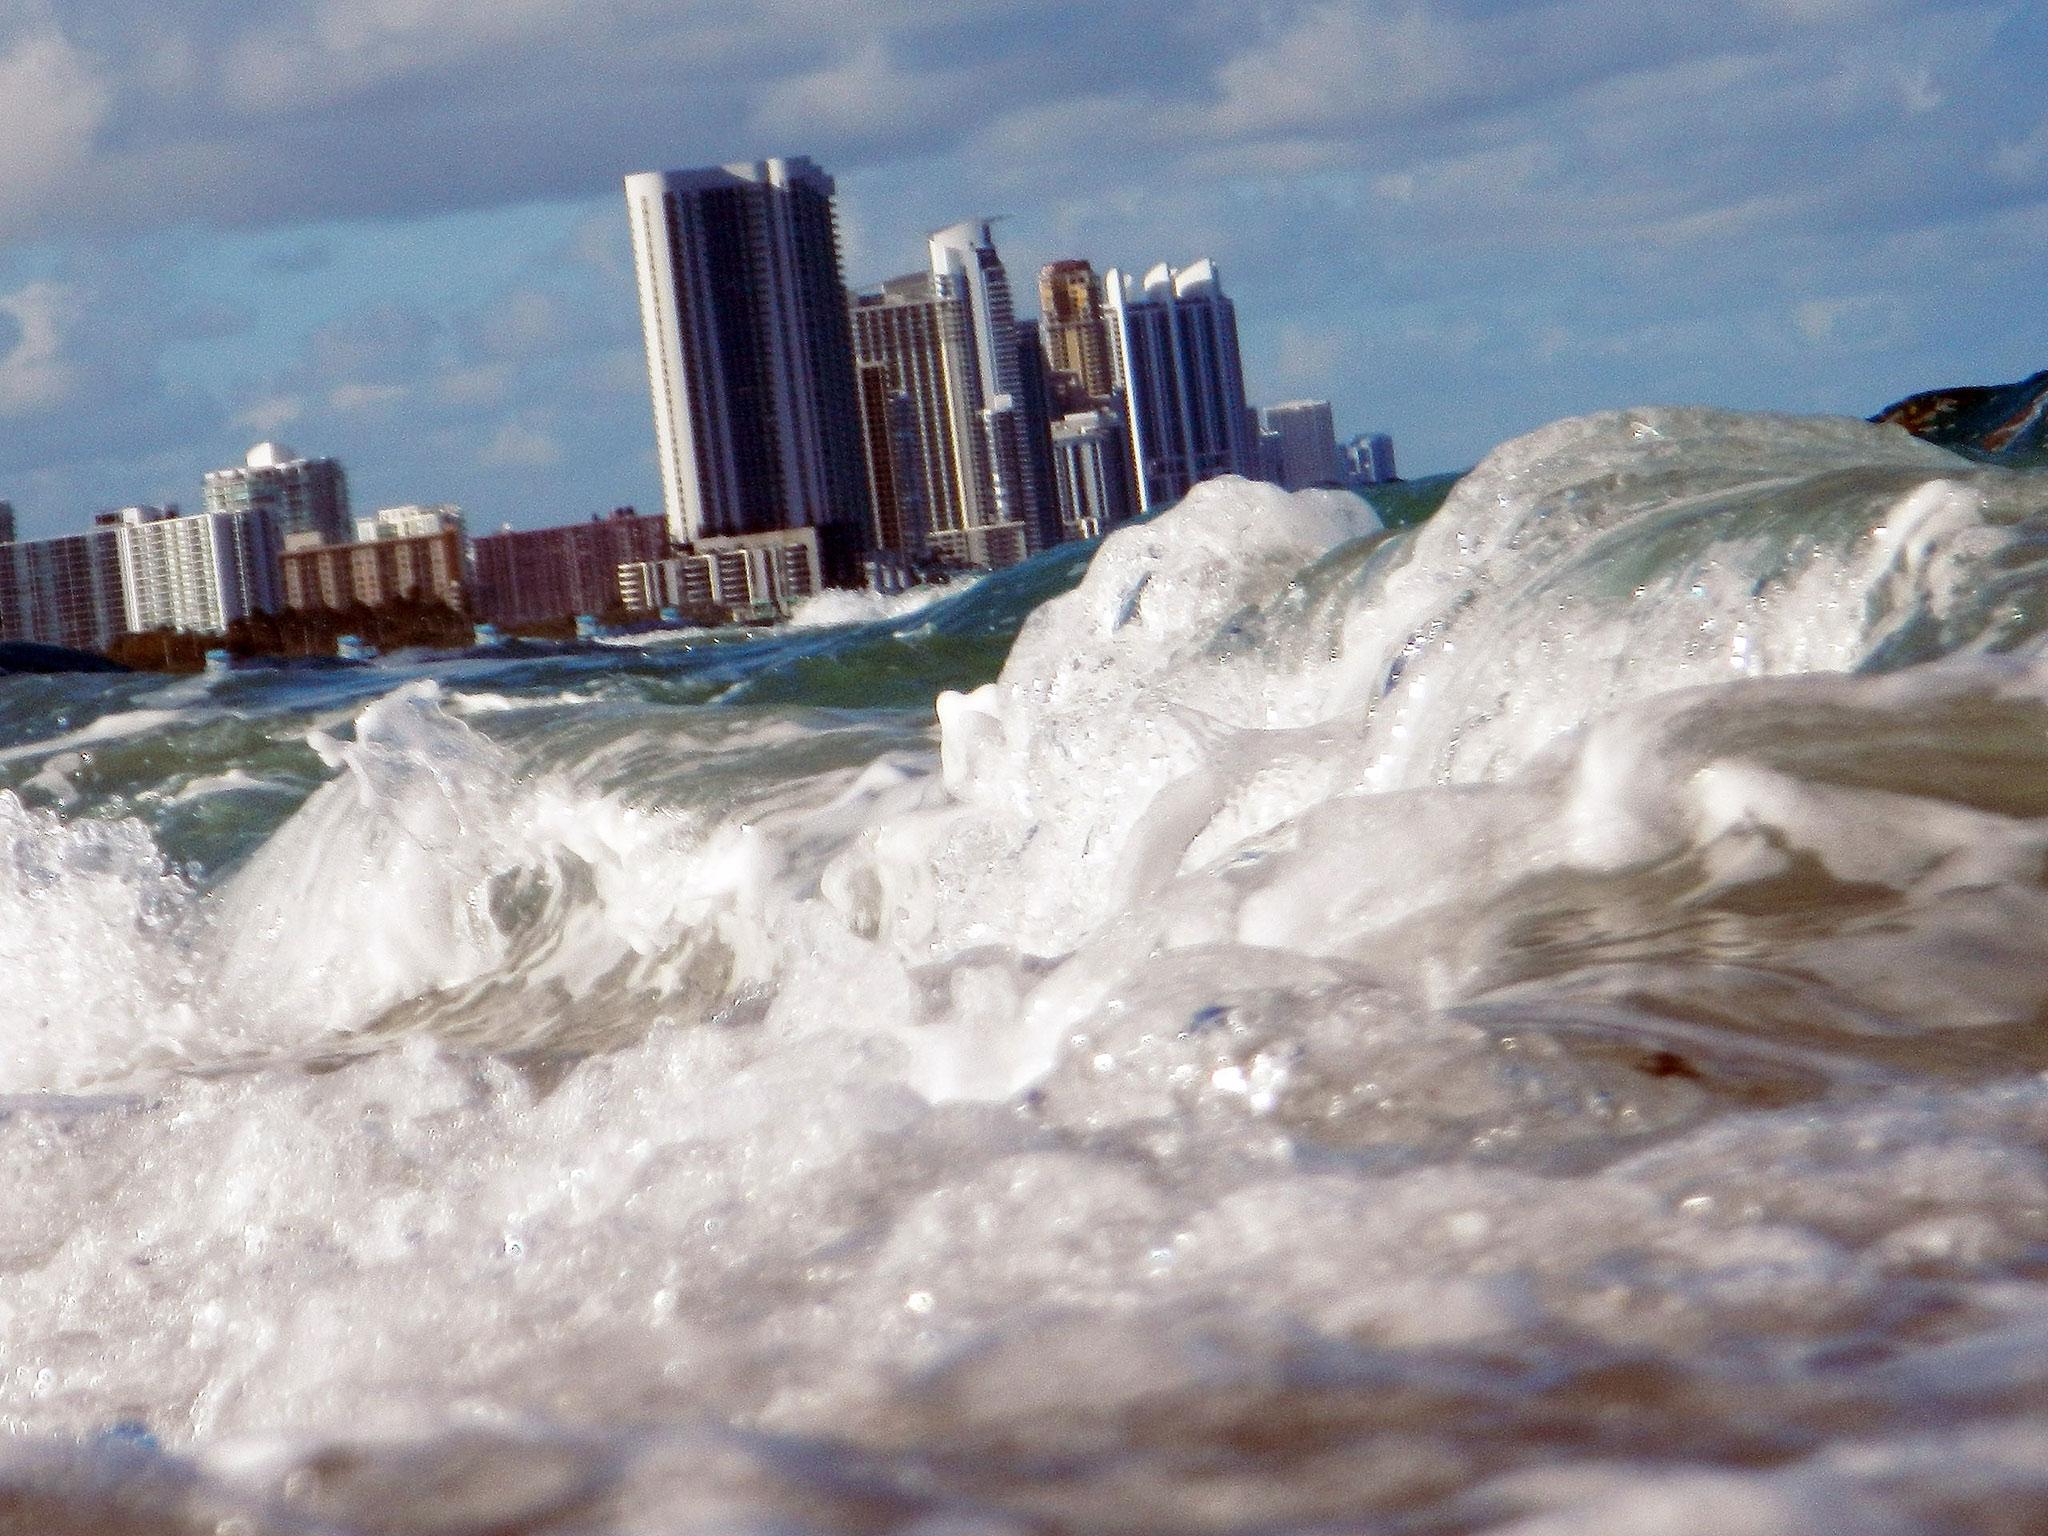
This graph shows how much the sea levels have risen as a consequence of global warming. The hotter the earth gets, the more the ice melts, which leads to rising sea levels and thus flooding.
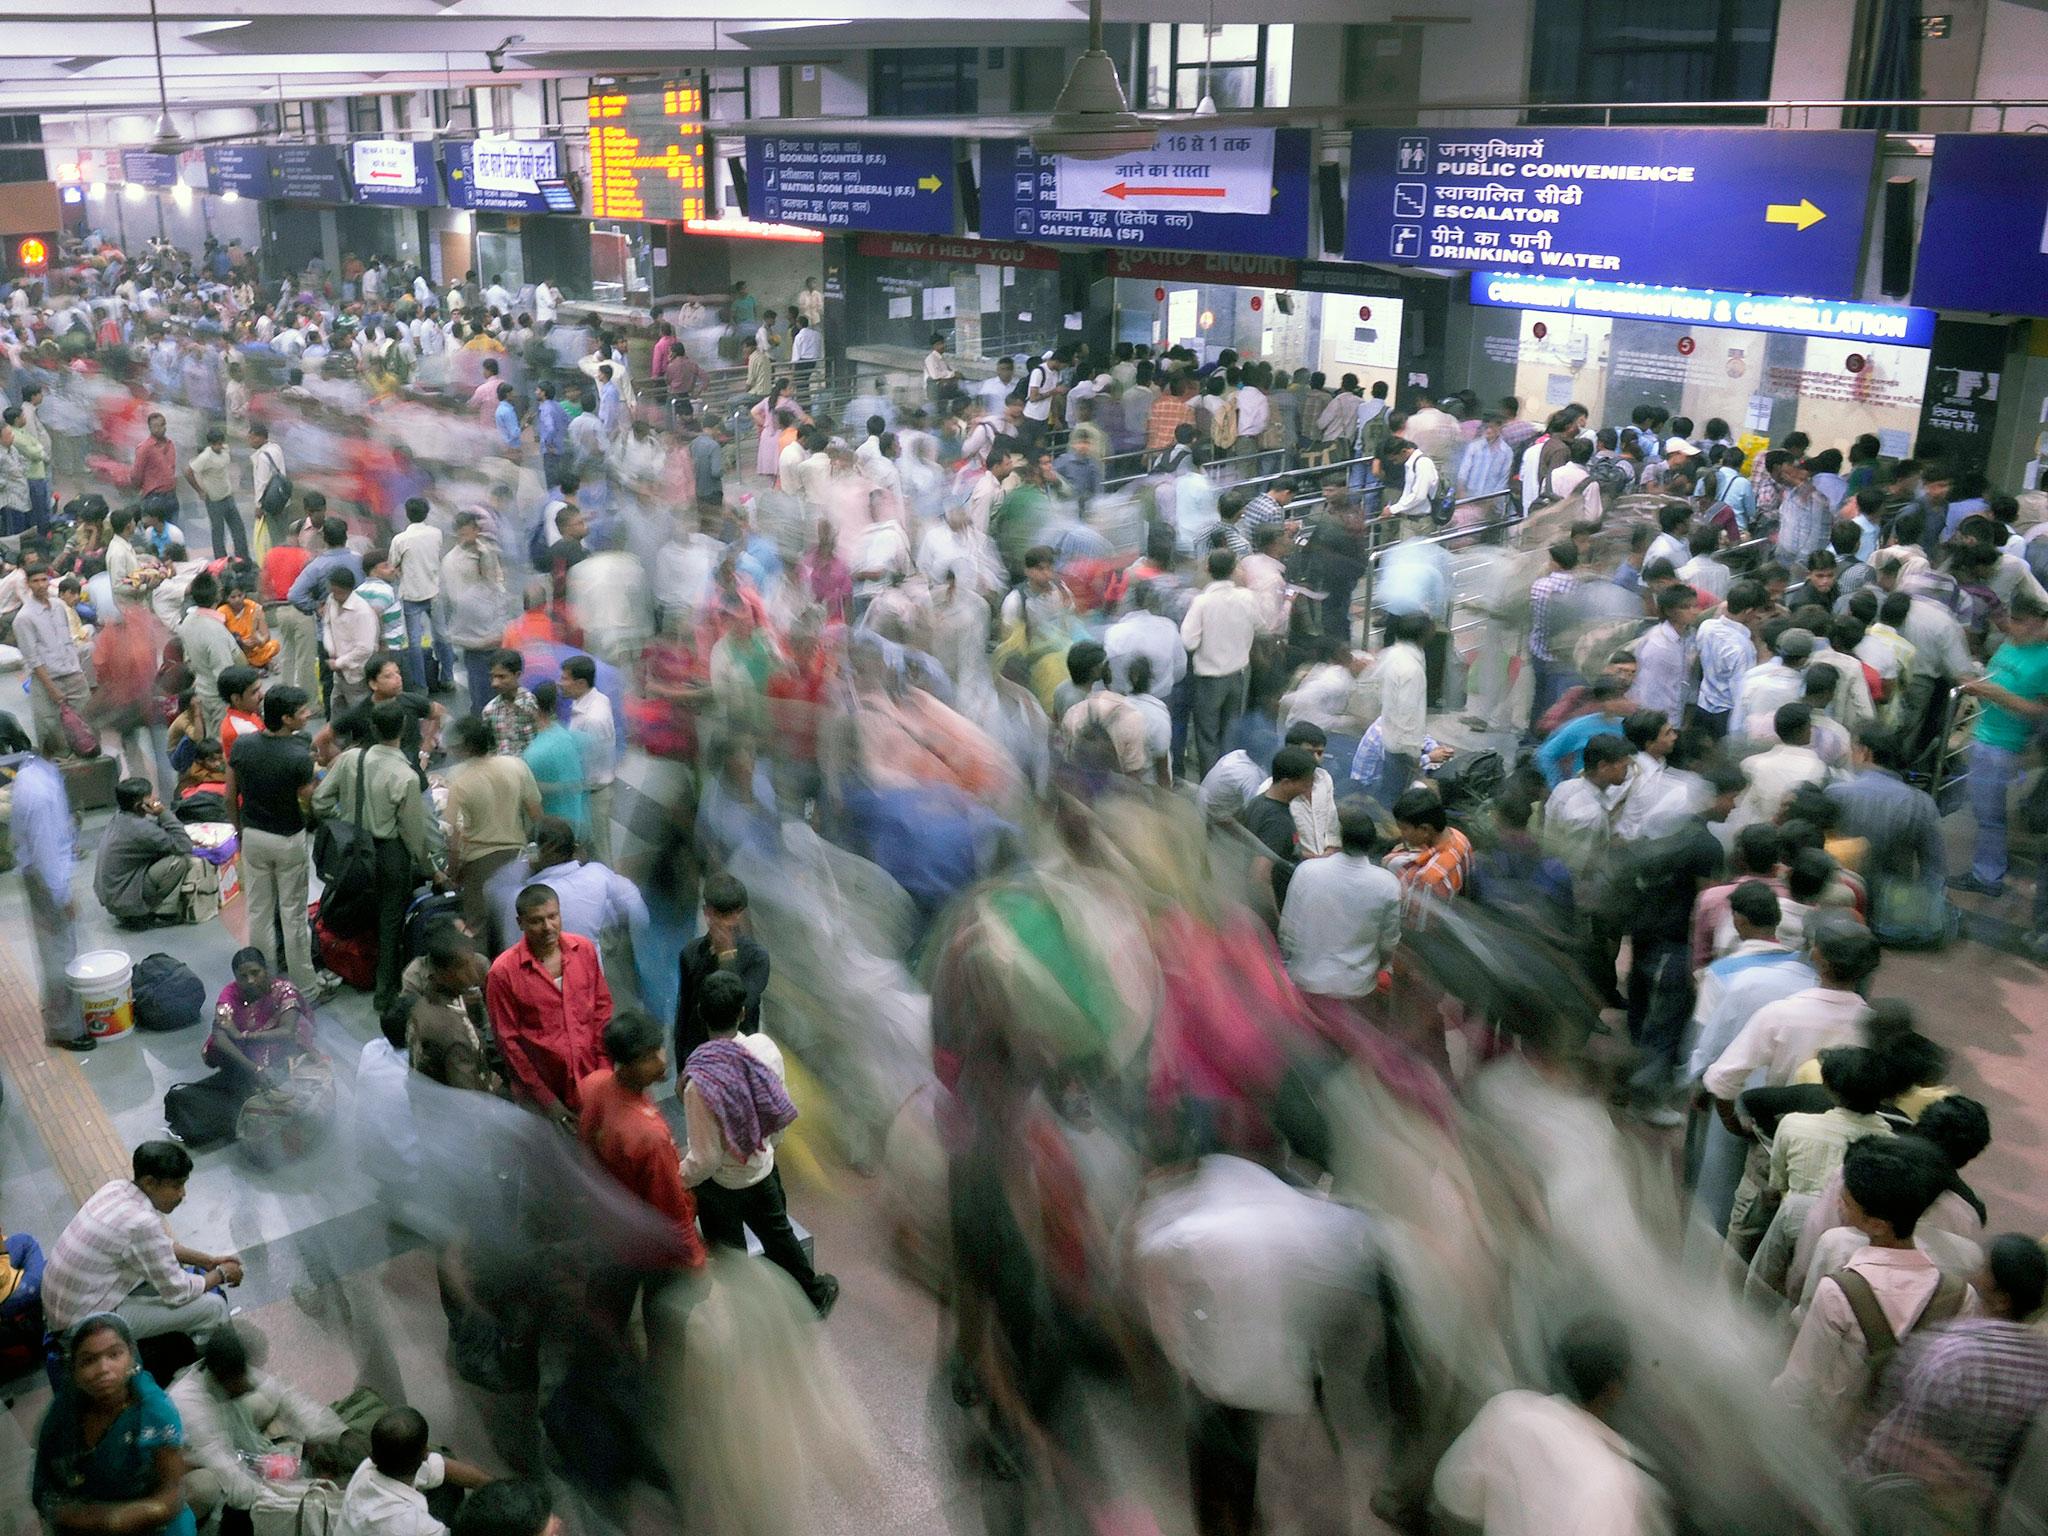
It’s no secret that the world population is booming. This graph shows the extent that humans are inhabiting the earth, putting pressure on the earth’s natural resources. There are around an extra 2,042m people living on the planet compared to 25 years ago.
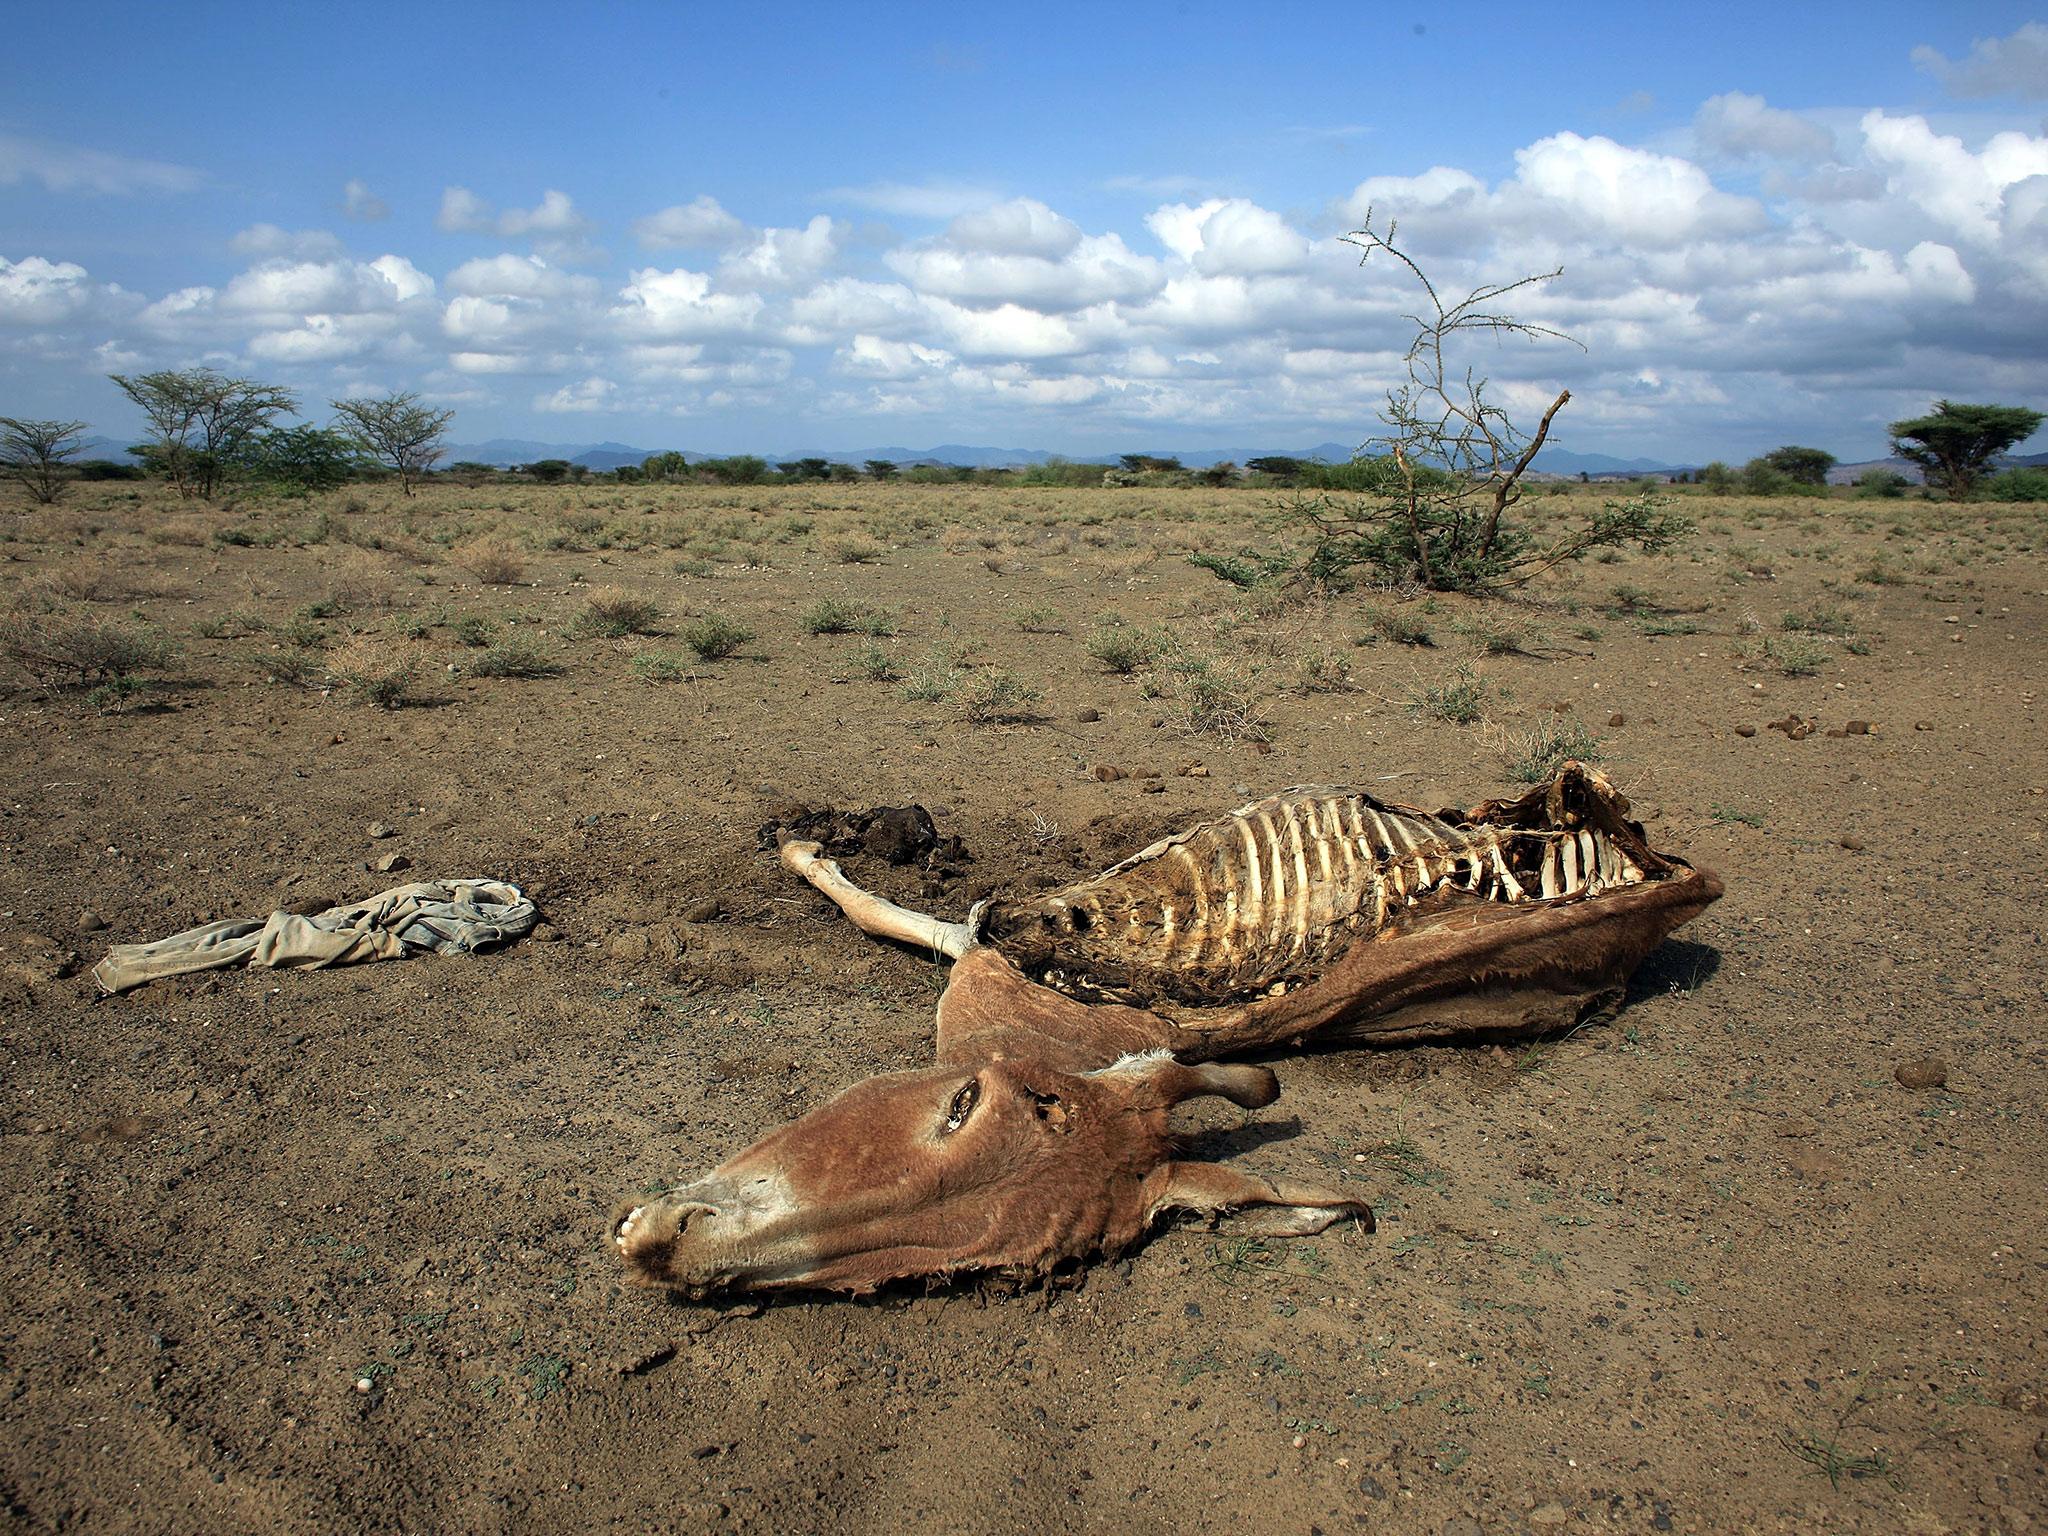
Due to global warming the planet is heating up, which is having several knock-on effects. For example, the rise in temperatures is leading to the polar ice caps melting and also leading to droughts.
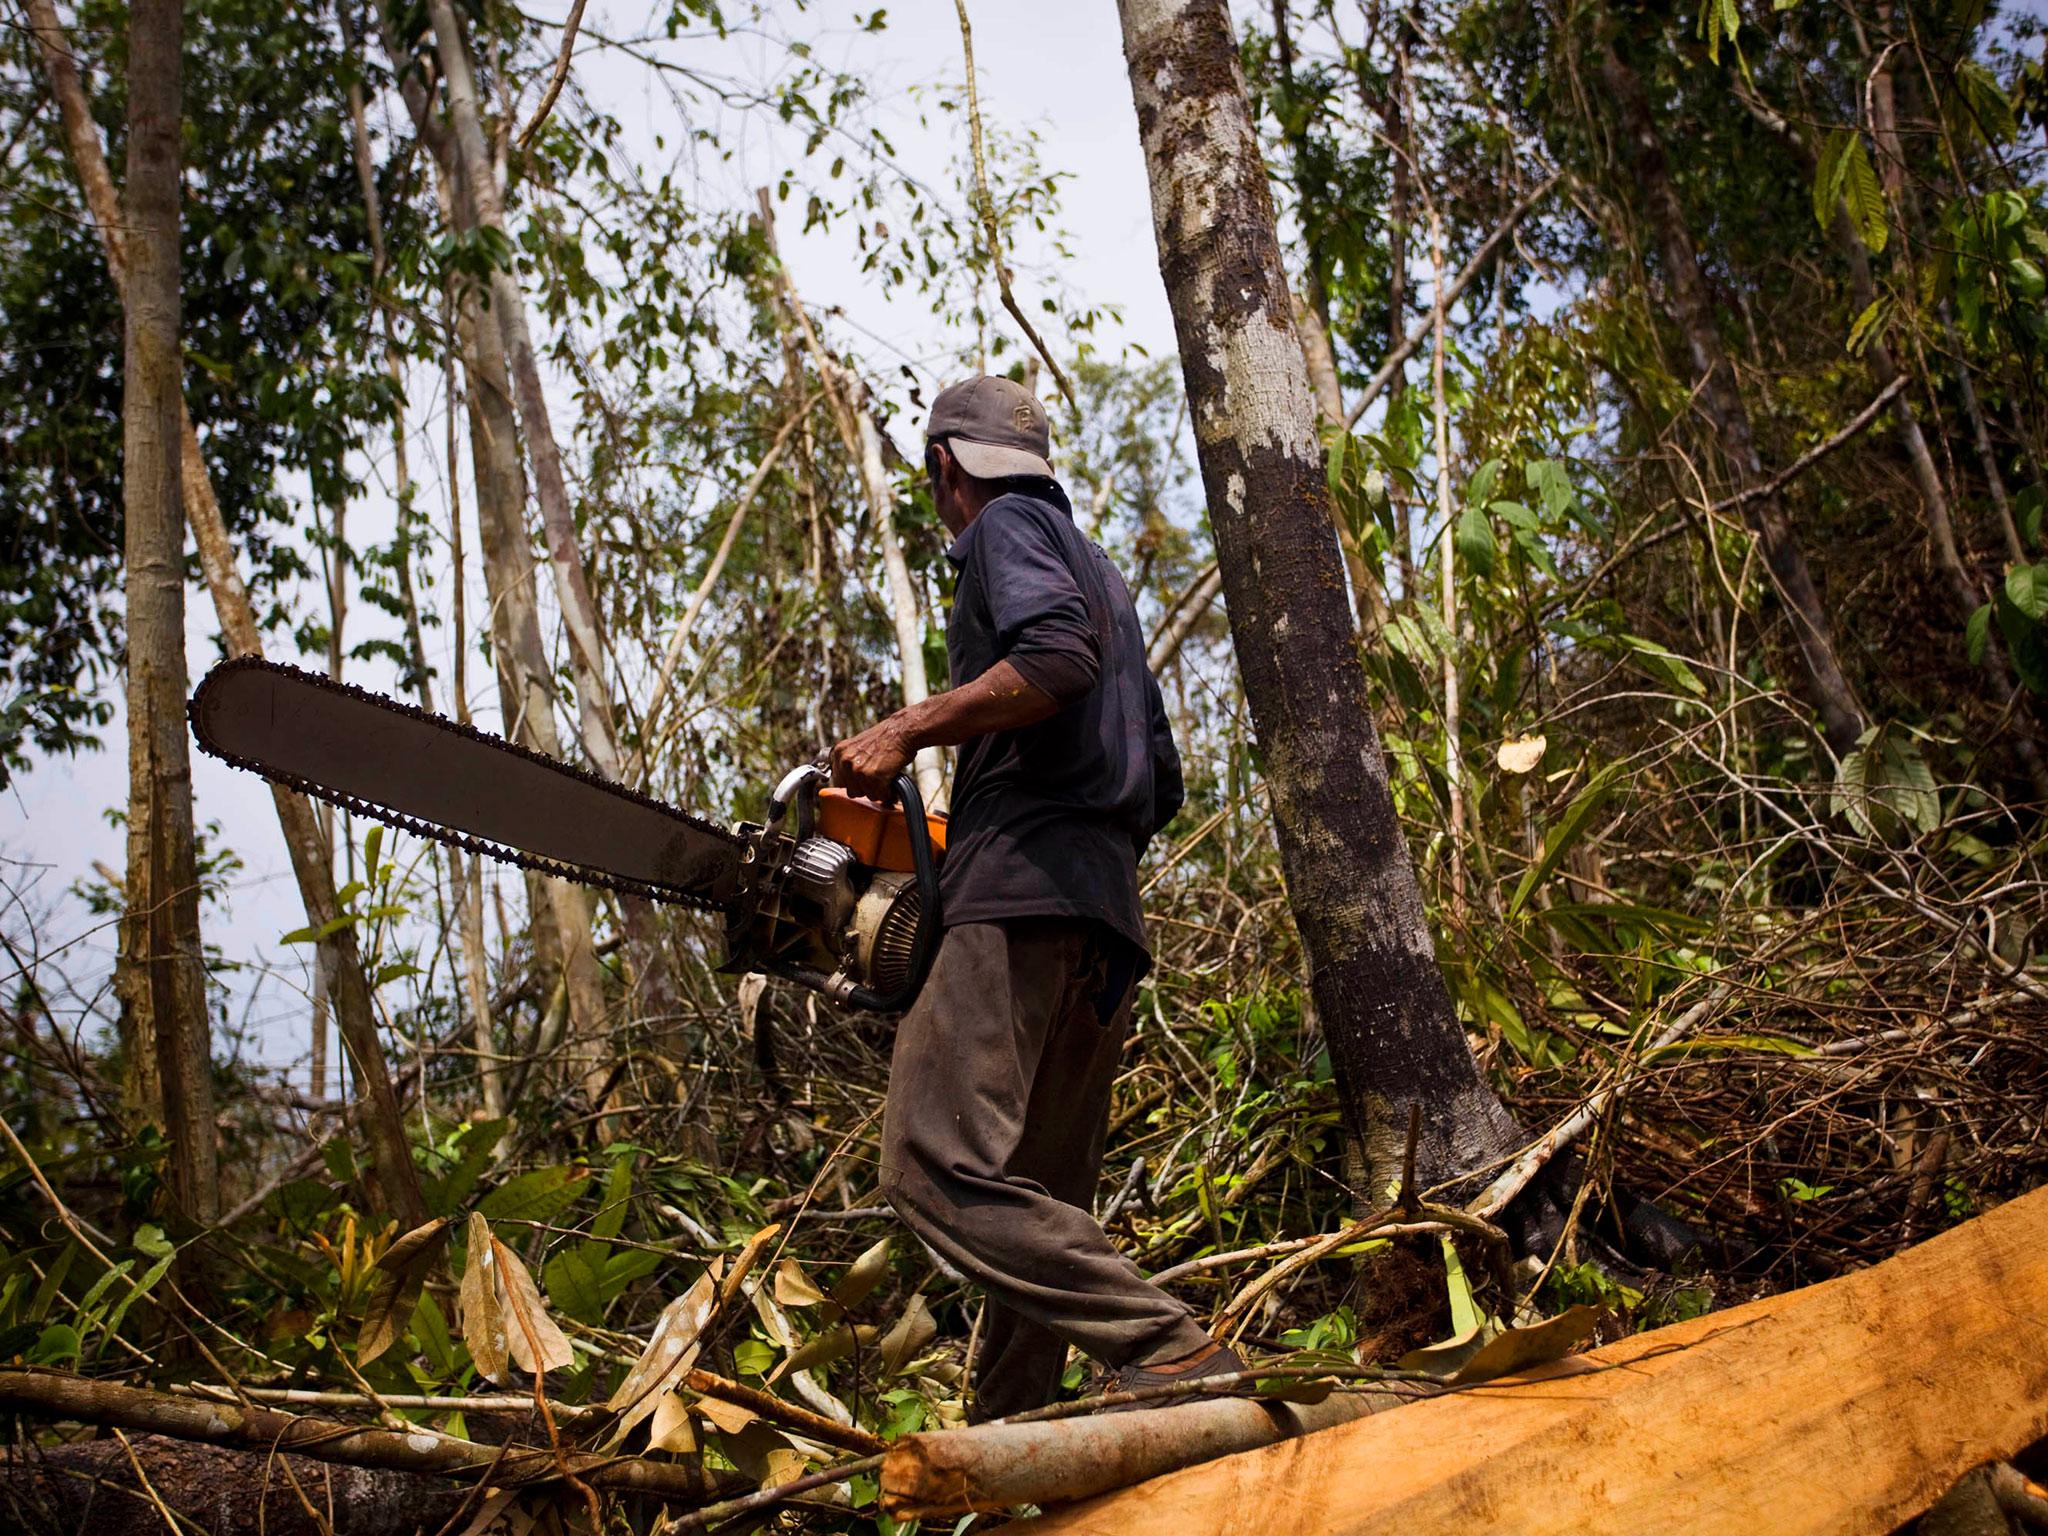
The deforestation of the Amazon rainforest has been happening since the 70s. In order to collect wood and create space for the cattle industry, the lush rainforests in the Amazon are cut down, destroying habitats and affecting climate change.
Join our commenting forum
Join thought-provoking conversations, follow other Independent readers and see their replies
Comments